The single most common mistake I see beginners make isn’t picking the wrong coin. It’s picking the right coin at the wrong time because they didn’t read the supply schedule. A token with a $200M market cap can look cheap — until you realise the fully diluted value is $4 billion and the unlock cliff is in six weeks. This is the post I wish someone had given me before I bought my first three altcoins.
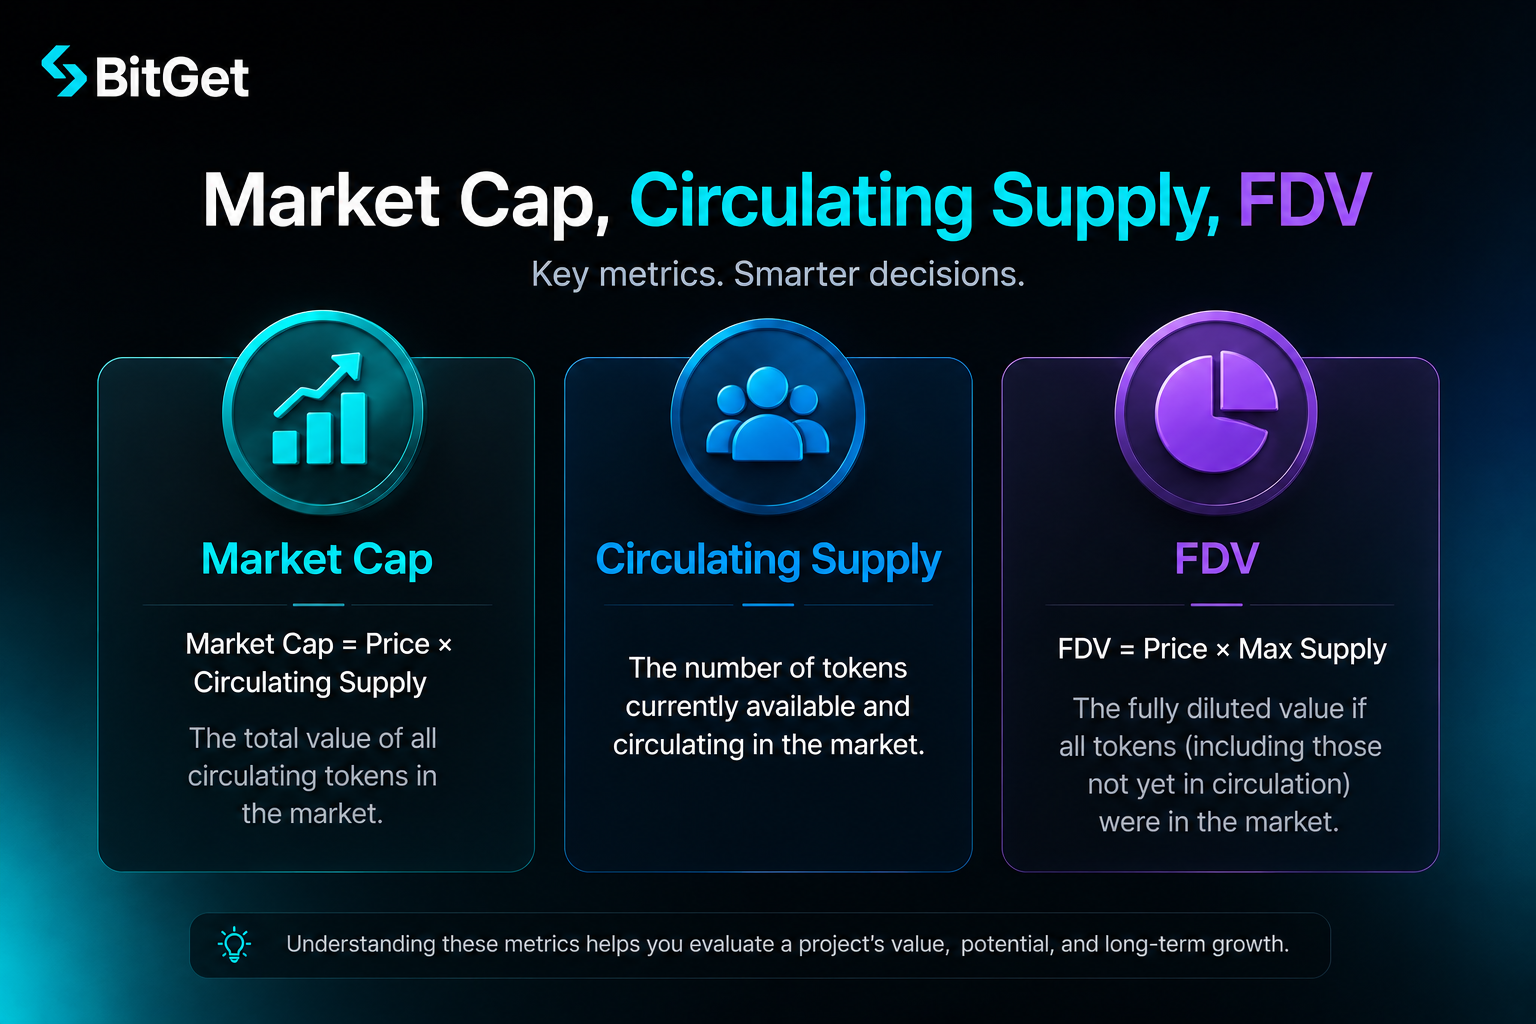
Short answer: Market cap = current price × circulating supply (the tokens actually trading). FDV = current price × max supply (every token that will ever exist, including locked/vesting). Beginners get caught when they buy a low-market-cap token without checking FDV, then watch the price collapse as locked supply unlocks. The single most important habit: always check market cap, FDV, AND token unlock schedule before buying any altcoin.
Start with the basics on BitGet (referral) — or get a hardware wallet first via Ledger (affiliate).
Key takeaways
- Market cap = current price × circulating supply. The metric most people quote.
- FDV (Fully Diluted Valuation) = current price × maximum supply. Includes locked + vesting tokens.
- A low market cap with a high FDV is a vesting-unlock trap.
- Circulating supply changes monthly as token unlocks vest — check the unlock schedule.
- For evaluating whether a coin is “cheap” relative to others, FDV is more honest than market cap.
What market cap actually is
Market cap (market capitalisation) is one of the simplest numbers in crypto and one of the most misunderstood.
The formula: Current price × circulating supply = market cap.
If Bitcoin trades at $65,000 and 19.8 million BTC are in circulation, BTC’s market cap is $65,000 × 19,800,000 = $1.287 trillion.
For Bitcoin and Ethereum, market cap is a reasonable proxy for the size of the network. The supply schedule is well-understood, most of the supply is in circulation, and the inflation rate is low.
For new altcoins, market cap is often misleading. The reason: circulating supply often represents 10–20% of the eventual total supply. The other 80–90% is locked in vesting schedules and will hit the market gradually over months and years.
If you’re brand new to crypto, the broader context for what tokens even are is in what is Bitcoin and what is Ethereum. Blockchain explained covers the underlying mechanics.
Why market cap matters (and where it fails)
Market cap is the metric most people use to compare crypto projects. It answers the question “how big is this thing today?”
It’s the right metric when:
– Comparing established assets with stable supply (BTC, ETH, established L1s)
– Sorting exchanges and tokens by current trading liquidity
– Estimating slippage for large trades
It fails when:
– A newer token has 10% of supply circulating, 90% locked
– Comparing two tokens with very different supply schedules
– Estimating long-term price pressure from upcoming unlocks
The trap: a token with $200M market cap looks “small” relative to BTC’s $1.3T. Beginners buy expecting the same upside ratio. But if that small token has a $4B FDV and 90% of supply unlocking over 24 months, the dilution alone can swallow any price appreciation.
Circulating supply vs total supply vs max supply
Three different numbers and they get used interchangeably even when they shouldn’t.
Circulating supply: Tokens currently in the hands of the public. They can be sold today.
Total supply: All tokens that have been minted, including locked tokens (held by the team, foundation, investors in vesting contracts). Not yet sellable.
Max supply: The maximum number of tokens that will ever exist (per the protocol’s design). For Bitcoin this is 21 million. For some chains there is no max supply (inflationary by design).
Here are examples to show how different these can be:
| Token | Circulating | Total | Max |
|---|---|---|---|
| Bitcoin | ~19.8M | ~19.8M | 21M |
| Ethereum | ~120M | ~120M | Unlimited (variable inflation) |
| Solana | ~470M | ~580M | Unlimited |
| Aptos (APT) | ~570M | ~1.1B+ | Unlimited |
| Arbitrum (ARB) | ~3.5B | 10B | 10B |
For BTC, circulating ≈ max. The dilution risk is tiny.
For ARB, circulating is 35% of max. Of the 6.5B tokens not yet in circulation, a large chunk vests on a fixed schedule (covered when discussing the March 2023 airdrop in how to buy Arbitrum). Every unlock is downward pressure on the price.
This isn’t theoretical — it’s the single biggest factor in altcoin underperformance after launch.
What FDV (Fully Diluted Valuation) means
FDV = current price × max supply.
It tells you what the market cap WOULD be if every token that will ever exist were trading today.
Example using fictional Token X:
– Circulating supply: 50M
– Max supply: 1B
– Current price: $5
– Market cap: 50M × $5 = $250M
– FDV: 1B × $5 = $5B
That’s a 20x gap between market cap and FDV. Buying at “$250M market cap” feels cheap. But the market is implicitly pricing in $5B of total dilution.
When the next vesting unlock dumps 100M tokens onto the market, sellers will hit bids. The price will need to absorb that supply. For tokens with 95% of supply still vesting, sustained price appreciation requires the buying pressure to grow faster than the unlock supply hits.
Most altcoins don’t grow buying pressure fast enough. The result is price decay during the high-unlock years (typically months 6–36 after launch).
Why FDV is a trap for new altcoins
A working example from a category that traps beginners constantly: new L1 launches.
A new L1 launches with $5 price, 100M circulating supply (10% of max). Total supply: 1B. Max supply: 1B.
- Market cap: $500M (looks “small”)
- FDV: $5B
Beginners see the small market cap, think “this is the next [bigger L1] at $50B market cap, 10x upside is reasonable.”
What actually happens:
– Month 6: 50M tokens unlock from team/investor vesting. Price drops as some holders sell. New circulating: 150M.
– Month 12: another 100M unlocks. More selling pressure. New circulating: 250M.
– Month 24: another 200M unlocks. New circulating: 450M.
For the price to merely stay flat through these unlocks, buying demand has to grow proportionally. For the price to rise, demand has to outpace dilution. Most L1s see neither happen.
The same logic applies to airdropped governance tokens, gaming tokens, AI tokens, and most VC-funded crypto projects.
The defence: always check the unlock schedule.
Token unlock schedules — how to find them
The data exists publicly. Tools to use:
- TokenUnlocks (token.unlocks.app): the dedicated tracker. Shows upcoming unlocks, vesting curves, and category breakdowns (team, investor, foundation).
- CoinGecko: includes vesting timelines on the token detail page.
- CoinMarketCap: lists circulating, total, and max supply on every token page.
- The project’s whitepaper or tokenomics page: the original source for unlock schedules. Always cross-check.
Before buying any altcoin, my checklist:
– Market cap (today’s “size”)
– FDV (eventual size at today’s price)
– Ratio (FDV / market cap = dilution multiplier)
– Next unlock date and size
– Cumulative unlocks over the next 12 months
If FDV is more than 5x market cap AND there’s a major unlock in the next 90 days, I either skip or size very small.
Realised cap (the on-chain version)
There’s a fourth metric mostly used by Bitcoin analysts: realised cap.
Realised cap values each unit of supply at the price it was last moved. It captures the “cost basis” of the network. If realised cap is rising while price is flat, holders are accumulating at higher prices — bullish signal. If realised cap is falling while price is rising, holders are selling into strength — bearish signal.
Realised cap is mostly used for Bitcoin and Ethereum analysis. It’s not a primary tool for retail altcoin evaluation but worth knowing about for advanced reading.
Glassnode and CryptoQuant publish realised cap charts for major coins. CoinDesk and Reuters cover macro moves in realised cap during cycle inflection points.
Comparing chains/tokens fairly using these metrics
Two tokens both at $1B market cap. Same opportunity? No.
Token A: $1B market cap, $1.2B FDV, 83% of supply circulating. Mostly distributed. Limited future dilution.
Token B: $1B market cap, $20B FDV, 5% of supply circulating. Huge dilution ahead. Vesting unlocks could double circulating supply every 6 months for the next 2 years.
Same headline number. Wildly different risk profiles.
When evaluating a new coin to add to your portfolio:
1. Compare FDV to FDV, not market cap to market cap
2. Check the FDV / market cap ratio
3. Check the 12-month unlock schedule
4. Compare it to similar-FDV established projects to see what “fair” looks like
This is where the work is. Most beginners only look at market cap. Doing this much more carefully is a real edge.
Buy your first crypto on BitGet
Then use what you’ve learned here to evaluate what to buy and when.
Referral link.
How to use CoinGecko and CoinMarketCap for research
Both sites publish the same core data and are free. Where they differ:
CoinGecko: more in-depth metrics, better trust score on exchanges, more detailed tokenomics on smaller projects. The “Token Holders” section is useful for seeing concentration risk.
CoinMarketCap: owned by Binance, slightly more polished, more news integration. The “Markets” tab shows which exchanges support each token at what volumes.
For evaluating an altcoin:
1. Search the token on CoinGecko.
2. Note: current price, market cap, FDV, circulating/total/max supply, 24h volume.
3. Click the “Tokenomics” tab. Read the supply allocation breakdown.
4. Cross-check FDV against the project’s whitepaper.
5. Look at the token’s market depth — high volume on multiple major exchanges = real liquidity, low volume on a few exchanges = liquidity trap.
6. Read the “About” section for context.
This is 10 minutes of work per token. It will save you from buying at least 80% of the altcoin traps that catch beginners. For more on building proper research habits, Trade Travel Chill (referral) is the trading community I’m part of and covers this kind of evaluation framework in detail.
Common misconceptions
“Low market cap means more upside.” Only if the token has utility and supply schedule that supports growth. Most low-cap tokens are low cap for a reason.
“This token is cheaper than Bitcoin so it has further to grow.” Price per token is irrelevant. A token at $0.01 with 1 trillion supply has the same market cap as a token at $10,000 with 1 million supply. Compare by market cap or FDV, not price.
“100x is realistic because [token X] did it.” Survivorship bias. The handful of tokens that 100x’d are massively outnumbered by tokens that went to zero.
“FDV doesn’t matter because the unlocks are years away.” Unlocks compound. A linear vesting schedule means consistent selling pressure for the duration. Markets price in expected dilution months before the actual unlock happens.
How this connects to actually buying crypto
Knowing these metrics lets you make better decisions when buying. Practical application:
- Before buying any token via how to buy crypto, check FDV and unlock schedule.
- Stick to high-circulating-supply, low-FDV-multiplier tokens for most of your portfolio (BTC, ETH, established alts).
- Allocate only small portions to high-FDV-multiplier speculation.
- Storage decision (exchange vs Ledger) follows the same logic — long-term holdings on Ledger Nano X, trading float on BitGet. Covered in how to store crypto safely.
For broader fundamentals on evaluating tokens, crypto for beginners and crypto wallets explained cover the prerequisites.
Frequently asked questions
Which is more important, market cap or FDV?
Both. Market cap shows current size. FDV shows eventual size at today’s price. The ratio between them shows dilution risk. Always check both.
What’s a good FDV / market cap ratio?
For low-risk tokens, 1.2 or below (most supply already circulating). Between 2 and 5 is moderate dilution risk. Above 5 is high dilution and demands careful unlock-schedule scrutiny. Above 20 is mostly speculation.
Where can I see token unlock schedules?
TokenUnlocks (token.unlocks.app) is the dedicated tracker. CoinGecko and CoinMarketCap also list vesting data on each token’s detail page.
What’s the difference between max supply and total supply?
Total supply = tokens already minted (including locked). Max supply = the maximum number that will ever be minted per protocol design. Some tokens have no max supply (inflationary like ETH variable issuance, or post-merge SOL).
Why does Bitcoin’s FDV equal its market cap?
Because nearly all of Bitcoin’s supply is already circulating (~19.8M of 21M). The remaining ~1.2M will be mined over the next ~115 years. The difference is small enough that BTC’s market cap and FDV are roughly equivalent.
Are FDV-based comparisons fair across different blockchains?
They’re more honest than market-cap-based comparisons. But they’re not the whole story — utility, adoption, on-chain activity, and developer ecosystem all factor in. FDV gives you the financial comparison; the other metrics tell you what you’re buying.
How often should I check unlock schedules?
Quarterly review of any altcoin holdings. Major unlocks announced 30+ days in advance often get priced in early.
Apply what you’ve learned
Open a BitGet account and start with high-circulating-supply majors — Bitcoin, Ethereum, blue-chip L1s.
Referral link.
Related posts
- Crypto for Beginners: The Honest Starting Guide
- What is Bitcoin? Explained Without the Hype
- What is Ethereum? A Plain English Guide