A friend asked me last summer why his grid bot was bleeding. He’d set it on SOL, picked a range that made sense in February, and forgot about it. By July the price had walked out the top of his range and the bot was sitting in pure USDT, watching the rally on the sidelines. He’d paid fees on the way up and missed the upside.
That’s the grid bot story most people never tell you. It’s not magic. It’s a tool with a narrow job. Get the job right and it prints small, steady returns. Get it wrong and it underperforms a savings account. This is how I run mine — settings, mistakes, and when I switch the thing off. Some links here are affiliate. I’ll flag them.
Short answer: The BitGet spot grid bot buys and sells a pair automatically inside a price range you set, profiting from chop and sideways action. You pick the upper bound, lower bound, grid count, and capital. Realistic returns are 0.8–2% per month in ranging markets, and roughly breakeven (minus fees) in strong trends. It works best on liquid majors like BTC/USDT and ETH/USDT, not low-cap alts.
See the bot I run on BTC/USDT → (affiliate)
Key takeaways
- A spot grid bot buys low and sells high inside a fixed price range — it does not predict direction.
- Range selection is the single biggest variable. Get the range wrong and nothing else matters.
- BitGet’s native grid bot is free to deploy, no API keys, no third-party platform fees.
- Realistic monthly returns on BTC/USDT: roughly 0.8–2% in chop, near zero in strong trends.
- Best pairs are liquid majors with low spread. Worst pairs are low-cap alts with thin order books.
What a spot grid bot does (60 seconds)
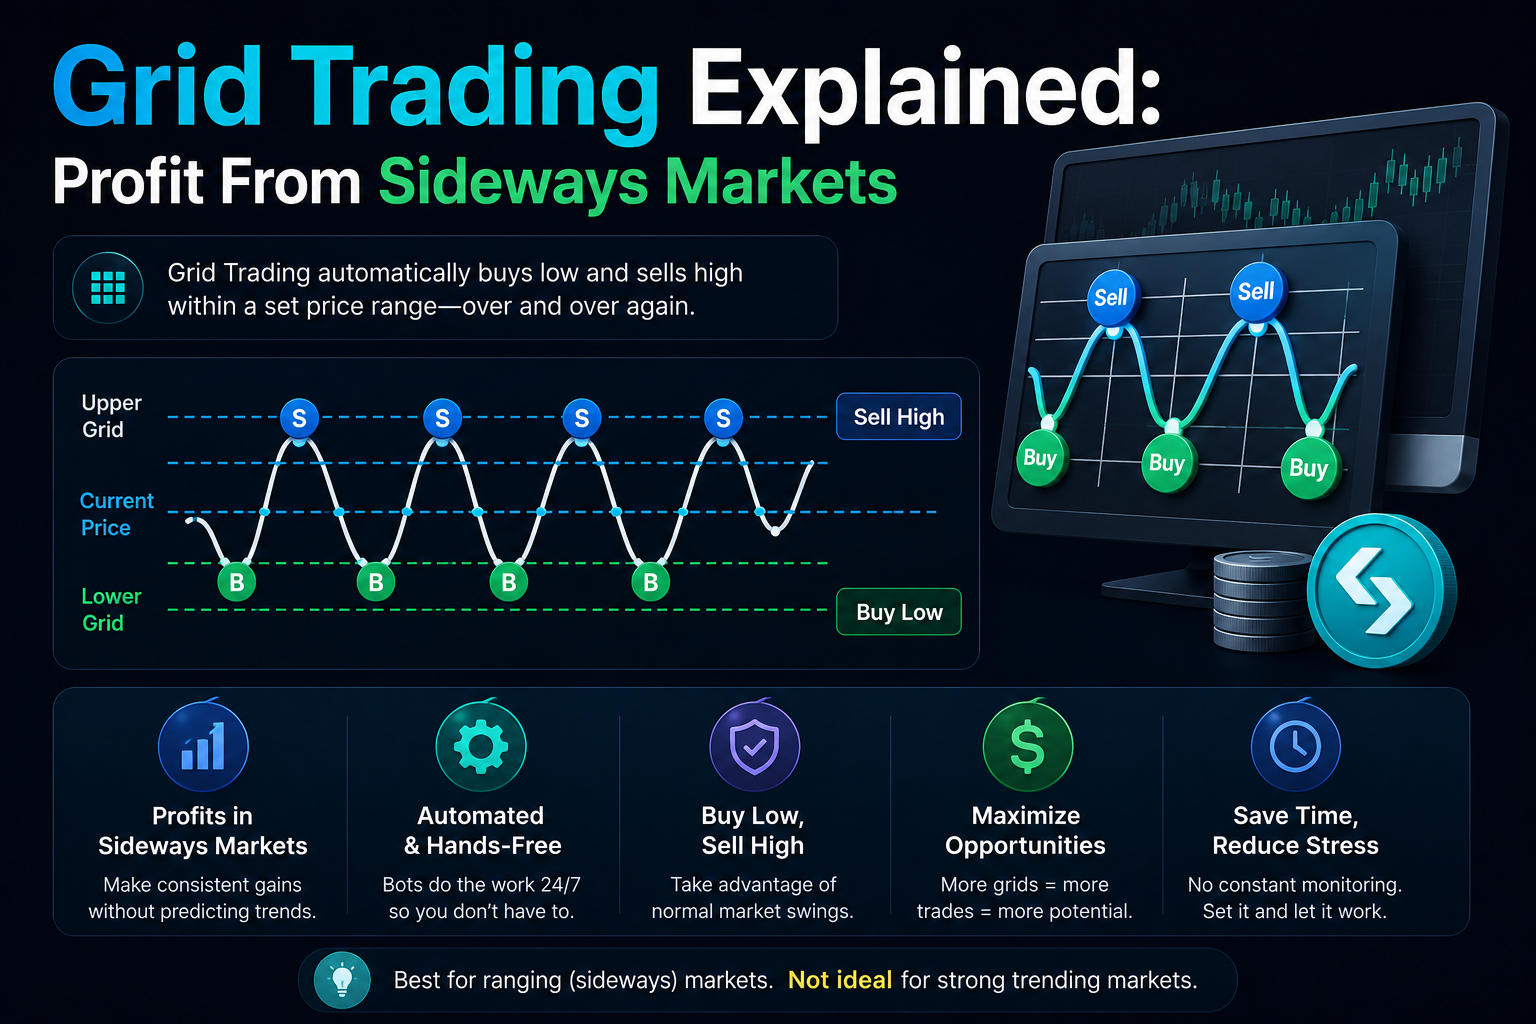
A spot grid bot splits a price range into a ladder of buy and sell orders.
Say you set a range of $60,000 to $70,000 on BTC/USDT with 20 grids. The bot drops 20 evenly spaced rungs across that range — roughly every $500. At each rung it places a buy order below and a sell order above. When price drops to a rung, it buys. When price rises to the next rung up, it sells. The profit per round trip is the gap between the two minus fees.
That’s the whole mechanic. No prediction. No AI. No signal feed. It exploits volatility inside a known range.
What it isn’t
It isn’t a futures bot. There’s no leverage. There’s no liquidation. The worst case is you end up holding the asset at a lower average price than you started, which for BTC over a long enough horizon has historically not been the worst outcome.
It also isn’t a trend-following bot. If price walks out the top of your range, the bot stops trading and you sit in pure USDT (or pure BTC if it walks out the bottom). You then either redeploy or wait for price to re-enter the range.
Why beginners love it (and lose money on it)
It’s easy to set up. Two clicks and it’s running. The dopamine hit comes from watching the “profits” counter tick up green every few hours. What new users miss is that the counter shows realised profit from completed round trips — it doesn’t show the unrealised loss on the inventory the bot is holding. The two together is the real P&L.
I’ll come back to this later because it’s where most people get sucked in.
When grid bots actually work (and lose money)
Three market conditions matter.
Strong chop — grid bots print
When BTC bounces between $62K and $68K for six weeks, my grid bot is the best-performing line in my portfolio. The price crosses rungs constantly. Each crossing is a fee-paid round trip with a small profit. Stack hundreds of those across a month and you get a useful return.
Strong trend up — grid bots underperform spot
If BTC rips from $60K to $80K in three weeks, the bot sells off its inventory as price climbs the rungs and ends up sitting in mostly USDT. You’d have made more just holding the BTC. The bot didn’t lose money — it just left a lot of upside on the table.
Strong trend down — grid bots take real damage
This is the dangerous one. The bot keeps buying as price drops, accumulating more and more inventory at lower and lower prices. If price keeps falling and never recovers to your range, you’re stuck holding bags. Unrealised loss on inventory eats the realised profit from the trades you did complete.
The maths only works if price eventually comes back into the range. For majors like BTC and ETH, it usually does — given enough time. For low-cap alts, sometimes it doesn’t, and you’re holding a token that’s down 80% with no recovery in sight.
The rule
Run grid bots on assets you’d be happy to hold long-term anyway. That’s the safety net when the trend goes against you.
BitGet vs 3Commas vs Pionex
Three platforms most people compare when picking a grid bot host. Quick head-to-head.
| BitGet (native) | 3Commas | Pionex | |
|---|---|---|---|
| Subscription fee | Free | $14–$59/month | Free |
| Exchange connection | Native (no API) | Connects to exchanges via API | Native (own exchange) |
| Pairs supported | 800+ spot pairs | Varies by connected exchange | ~350 pairs |
| Bot types | Spot grid, futures grid, DCA, Martingale, AI, Smart Trend | Grid, DCA, Smart Trade, Options | Grid, DCA, Arbitrage, Trailing |
| Backtesting | Limited (in-app) | Yes, deeper | Yes, simple |
| Mobile app | Yes | Yes | Yes |
| Profit-share copy bots | Yes | No | No |
The case for BitGet’s native bot is simple: it’s free, it runs inside the exchange where your funds already sit, and you don’t need to manage API keys. The case for 3Commas is deeper backtesting and the ability to run the same strategy across multiple exchanges. The case for Pionex is the breadth of bot types if you like experimenting.
I run native on BitGet because I’m already on the exchange for spot and copy trading. One less tool to maintain. If you’re already paying for 3Commas for other reasons, fine. If you’re starting fresh, native saves you the subscription.
Full breakdown across all the bot platforms is in the crypto trading bots guide.
How to set up your first grid bot (step-by-step)
Eight steps. Should take about 10 minutes if you’ve already got a BitGet account and funds in spot.
- Log into BitGet and go to the Trading Bots section in the top menu.
- Select Spot Grid. You’ll see a list of preset strategies and the option to create your own.
- Pick a pair. BTC/USDT, ETH/USDT, SOL/USDT — start with a major.
- Set the price range. Upper bound and lower bound. This is the bit everyone gets wrong. More on this in the next sections.
- Set the grid count. How many rungs in the ladder. Typical range: 20–100. Higher count = more trades, smaller profit per trade.
- Pick AI strategy or manual. AI picks range and grid count for you based on recent volatility. Manual gives you full control.
- Allocate capital. How much USDT (and optionally how much of the base token) goes into the bot.
- Deploy. Confirm and the bot starts placing orders within seconds.
You can monitor performance from the My Bots dashboard. Stats include realised profit, total trades executed, current position, and annualised return estimate.
Don’t trust the annualised return number. It’s extrapolated from a short window and assumes the same conditions hold. They never do.
If you’ve never placed an order on BitGet at all, do the BitGet spot trading guide first. The bot UI assumes you understand market vs limit orders.
Grid count — how many levels
The grid count is the number of buy/sell rungs in your ladder. It sounds technical. It’s actually simple to reason about.
More grids = more trades, smaller profit per trade
100 grids across a $10K range = a rung every $100. Tiny moves trigger trades. Profit per round trip is small. Trade volume is high. Fees eat a bigger chunk of each round trip.
20 grids across the same $10K range = a rung every $500. Larger moves needed to trigger trades. Profit per round trip is bigger. Fewer trades total.
My rule of thumb
For BTC/USDT, I use 40–60 grids on a 15–20% range. That works out at roughly 0.3–0.5% per round trip before fees. BitGet charges 0.10% per side, so 0.2% in fees per round trip — leaving 0.1–0.3% net profit per trade.
For ETH/USDT, similar grid density. ETH is slightly more volatile than BTC so I sometimes go denser (60–80 grids) to capture more moves.
For SOL/USDT or other higher-volatility majors, I drop grid count to 30–40 because the price covers more ground per move and I want each rung to capture a meaningful gap.
The trap
Beginners crank the grid count to 200 because they think more trades = more profit. They forget that each trade pays fees. At 200 grids on a tight range, you’re often net negative once fees clear. The bot looks busy. The wallet doesn’t grow.
Test on paper or with a tiny capital amount first. Watch the actual net return over two weeks. Adjust.
Range — how to pick upper/lower bounds
This is the part of grid bot setup that matters more than everything else combined.
The 90-day high/low method
The simplest method that works for me:
- Pull the 90-day price chart for the pair.
- Note the 90-day high. That’s your upper bound.
- Note the 90-day low. That’s your lower bound.
- Add a 5–10% buffer on each side if you want to be safe.
This works because 90 days is long enough to capture a meaningful range but short enough that current market structure still applies. A 90-day window in BTC will usually catch one decent swing high and one decent swing low.
The standard deviation method (more advanced)
If you want to be more rigorous:
- Pull daily closes for the last 60 days.
- Calculate the mean price.
- Calculate the standard deviation.
- Set upper bound at mean + 2 standard deviations. Set lower bound at mean − 2 standard deviations.
Roughly 95% of price action will sit inside that range if the market continues to behave like the recent past. The bot trades efficiently inside the band and stops when price breaks out.
What everyone gets wrong
The two range mistakes I see constantly:
Range too tight. Someone sets BTC range at $66K–$70K because that’s where price has been for the last two weeks. The first 10% move in either direction pushes price out of the range and the bot stops trading. Whatever profit it made before the breakout gets dwarfed by the missed move.
Range too wide. Someone sets range at $40K–$120K to “be safe”. The grids are spaced so far apart that price rarely crosses a rung. The bot trades once a week. Realised profit is negligible. Capital sits idle.
The sweet spot is a range slightly wider than the recent volatility band. Wide enough to survive normal moves. Tight enough that price crosses rungs regularly.
When to redeploy
If price breaks out of your range and stays out for more than a few days, redeploy the bot with a new range that includes the new price. Don’t sit on a dead bot. The whole point is putting capital to work.
AI strategy vs manual
BitGet offers an “AI Strategy” toggle on grid bot setup. It picks the range and grid count for you based on recent volatility.
What it actually does
The AI mode looks at the last 7–30 days of price action, calculates a volatility-adjusted range, and picks a grid count that maximises expected return per BitGet’s own backtest model. It’s not predicting the future. It’s reading the past and applying a formula.
When AI mode is fine
If you’re brand new to grid bots and just want to see one run, AI mode is a reasonable starting point. It won’t blow up. It won’t pick a range so tight it stops trading on day one. It’s a sensible default.
When manual is better
If you have a view on the market (you think BTC is range-bound for the next quarter, or you think ETH will chop between $3K and $4K through a known catalyst window), manual lets you express that view. AI mode just reads price history and assumes the past continues.
Manual also lets you pick a wider range if you’re worried about a directional move. AI mode tends toward tighter ranges because they backtest better — but tighter ranges break more often in live conditions.
I use manual on BTC/USDT because I’ve watched enough cycles to have an opinion on the range. For pairs I don’t track as closely, I’ll sometimes start with AI mode and adjust after a week.
The honest take
AI Strategy isn’t AI in any meaningful sense. It’s a parameter-picking algorithm with a marketing label. Useful if you don’t want to think about it. Not magic.
Best pairs for grid bots on BitGet
Pair selection matters almost as much as range. Liquidity, spread, and volatility all play in.
What you want in a grid pair
- High liquidity so your buy and sell orders fill near the rung price, not slippage 0.5% off
- Tight spread so fees don’t eat the profit per round trip
- Moderate volatility so price crosses rungs regularly but not so violently that it walks out of range
- A history of mean-reverting behaviour rather than persistent trends
Pairs that fit
| Pair | Why it works |
|---|---|
| BTC/USDT | Deepest liquidity in crypto. Moderate volatility. Long history of ranging months interrupted by trends. |
| ETH/USDT | Second-deepest liquidity. Slightly more volatile than BTC. Strong correlation to BTC. |
| SOL/USDT | More volatile. Wider range, more trades. Higher risk of breakouts though. |
| BNB/USDT | Lower volatility, smaller profit per round trip, but very reliable for chop. |
| BGB/USDT | If you’re already holding BGB for fees, a grid on this works. Lower liquidity though. |
Pairs to avoid
| Pair type | Why to avoid |
|---|---|
| Low-cap alts | Thin order books mean slippage eats profit. Persistent downtrends are common. |
| New listings | No price history to set a range against. |
| Stablecoin pairs (USDT/USDC) | Almost no volatility. Bot doesn’t trade. |
| Meme coins | Extreme volatility breaks ranges constantly. |
My personal rotation
I run grids on BTC/USDT and ETH/USDT continuously. SOL/USDT during ranging windows, switched off during clear trends. Everything else is too high risk for a strategy that depends on mean reversion.
If you want the full list of bots I’ve tested on BitGet, the BitGet copy trading and BitGet earn products breakdowns cover the broader product surface.
My actual settings on BTC/USDT
I cover this in detail in the dedicated BTC/USDT spot bot post, but here’s the summary.
| Parameter | My setting |
|---|---|
| Pair | BTC/USDT |
| Range | 90-day low minus 5% to 90-day high plus 5% |
| Grid count | 50 |
| Capital allocation | 5–8% of trading float |
| Mode | Manual |
| Take-profit/stop | None on the bot — I monitor manually |
| Rebalance frequency | Every 30 days or on a clear range break |
I review the bot weekly. If price has walked outside the range and stayed there for more than five days, I pause it, take stock, and redeploy with a new range.
The exact numbers, the chart screenshots, and the monthly P&L are in the BTC/USDT spot bot deep-dive. If you want to skip the legwork and copy the bot directly, the link is the affiliate one at the top of the post.
Copy the BTC/USDT bot I run → (affiliate)
Risk: what can go wrong
Grid bots aren’t risk-free. The risks just look different from active trading.
Inventory risk
The biggest one. The bot keeps buying as price falls. If price falls a long way and stays there, you’re holding inventory at an average above market. The longer the downtrend, the worse the unrealised loss.
Mitigation: only run grids on assets you’re happy to hold long-term, and size the capital allocation so you can stomach the drawdown.
Range break risk
Price walks out of your range and stays out. The bot stops trading. Capital sits idle. You miss the trend.
Mitigation: monitor the bot weekly. Redeploy with a fresh range if the breakout looks structural.
Fee drag
Every round trip pays fees. On thin profit per round trip (think 0.2% before fees, 0.0% after), the bot is just generating taxable events without growing the account.
Mitigation: hold BGB to get the 20% fee discount. Pick grid counts that leave meaningful profit per round trip after fees.
Platform risk
If BitGet has an outage, the bot can’t trade. If your account gets compromised, the bot is part of the surface area. If BitGet itself fails as a business, every penny in the bot is at risk.
Mitigation: don’t run grid bots on capital you can’t afford to lose. Keep long-term holdings on a Ledger Nano X. The bot float should be sized to your active-trading risk budget, not your savings.
Slippage on thin pairs
If you run a grid on a low-volume pair, the bot’s orders move the market. You buy higher than the rung and sell lower than the rung. The slippage compounds over hundreds of trades.
Mitigation: stick to pairs with billions in daily volume.
Tax implications
The thing most grid bot users forget: every round trip is a taxable event.
A grid bot running 200 round trips a month on BTC/USDT generates 200 taxable disposals. In jurisdictions that tax crypto-to-crypto (UK, US, most of EU), each of those entries has to be reported, with a cost basis, a sale price, and a gain or loss.
What this means in practice
You can’t track this manually. Export the trade history from BitGet (Reports section, CSV download) and import into Koinly, CoinTracker, or Cointracking. Those tools handle the maths and produce a tax report.
In the UK, HMRC’s “same-day” and “30-day” matching rules apply. Tax software handles this if you feed it complete data.
In the US, the IRS treats each disposal as a capital gain or loss. Short-term if held under 12 months (which the bot’s are, by definition).
Budget for tax
If the bot makes you 1.5% per month gross, and your effective tax rate on gains is 30%, your net return is closer to 1%. Plan accordingly.
I budget tax the same week the bot harvests profit. Out of every $100 of realised gain, $30 goes into a tax holding pot. By the time the bill arrives, the cash is sitting there.
If you want a broader view of passive income strategies and how they get taxed, passive income in crypto without getting rugged covers off-platform options too.
Bot vs DCA vs holding spot
Quick comparison to set expectations.
| Approach | Best for | Realistic return | Effort |
|---|---|---|---|
| Spot grid bot | Ranging markets | 0.8–2%/month in chop | Set once, review weekly |
| DCA (recurring buy) | Long-term accumulation | Matches asset price | Set once, ignore |
| Spot holding | Strong trends | Matches asset price | Zero |
| Active swing trading | Skilled traders | Variable | Daily |
The grid bot wins when the market is choppy and loses when it’s trending. DCA wins when the market trends up over time and loses if it trends down forever. Spot holding wins in strong uptrends and loses in strong downtrends.
The smart move is combining them. Most of my long-term BTC sits in cold storage. A small slice runs the grid bot. A separate slice goes into DCA via the BitGet auto-invest product. Three different bets on three different market conditions.
Mistakes I made running grids
I’ve been running grid bots on BitGet for about two years. The mistakes I’ll own:
Running a grid on a low-cap alt because the APY looked good. Price tanked 70% and stayed there. I’m still holding the bag. Lesson: majors only.
Setting a range too tight on ETH during a quiet week. Price ripped out of the range on a Tuesday news event. Bot sat in pure USDT for two weeks while ETH ran up 25%. Lesson: build the range wider than feels comfortable.
Cranking grid count to 100 on a tight range. Fees ate the realised profit. Net return was negative for a month. Lesson: count and range need to be set together, not independently.
Forgetting the bot existed. Set up, walked away, didn’t check for three months. Range had broken twice, redeployed once, and the parameters were stale. Lesson: weekly review.
Treating the displayed “annualised return” as real. That number is extrapolated. It assumes the same chop continues forever. It doesn’t.
When I switch the bot off
The signals I use to pause a grid bot:
- Strong directional break. Price closes outside the range for more than 5 days on a daily timeframe.
- Major news catalyst. Halving, ETF approvals, central bank surprise. Volatility spike usually breaks ranges.
- Funding rate extremes on the equivalent perp. If perp funding is wildly positive or negative, a trend is brewing.
- Volatility collapse. If the bot hasn’t traded in over a week, the range is too wide or the market is dead.
Pausing the bot in those moments protects against inventory accumulation in a trend. I’ll redeploy after the move resolves with a new range that reflects the new structure.
The grid bot is a tool for a specific market condition. Use it when conditions fit. Switch it off when they don’t.
Frequently asked questions
How much money do I need to start a BitGet spot grid bot?
There’s no fixed minimum, but practically you want enough capital that the grid count makes sense. With 50 grids, you want at least $500–$1,000 in the bot so each rung trades a meaningful size. Below that and fees eat too much of each round trip.
Can I run multiple grid bots at once?
Yes. I run 2–3 simultaneously across BTC/USDT, ETH/USDT, and sometimes SOL/USDT. Each is allocated separately. They don’t interfere with each other because they use independent capital pools.
What happens if BitGet goes down?
The bot pauses. Your existing orders remain on the book and may fill if the matching engine is still running, but no new orders are placed until the platform is back. Historically BitGet outages have been short (minutes to a few hours). Plan as if outages are possible.
Does the grid bot use leverage?
No. The spot grid bot is unleveraged. It only buys and sells spot. The futures grid bot (a separate product) does use leverage and carries liquidation risk.
Is the grid bot profit guaranteed?
No. Past performance does not predict future returns. In ranging markets the bot tends to be profitable. In trending markets it underperforms holding spot. In sustained downtrends it can accumulate inventory at a loss.
Can I withdraw funds while the bot is running?
You need to pause or close the bot first. Open bot positions are locked to the strategy.
What’s the difference between spot grid and futures grid?
Spot grid trades the actual asset with no leverage. Futures grid trades perpetual contracts with leverage and a liquidation price. Spot grid risk is bounded (worst case: you hold the asset). Futures grid risk is unbounded (worst case: liquidated, all margin gone).
My honest summary
The BitGet spot grid bot is a tool I’d recommend to any intermediate trader who wants a piece of their portfolio working passively in ranging markets. It’s not a get-rich-quick product. It’s a 1–2% per month grinder in good conditions, near zero in bad conditions.
The two things that matter: pick a major pair, and set a sensible range. Get those right and the rest of the parameters tolerate a wide margin of error. Get them wrong and the rest doesn’t save you.
If you want the exact settings I run, the BTC/USDT spot bot post has the chart screenshots and the monthly P&L. If you want to skip ahead, the affiliate link below opens the same bot I run.
Right — over to you.
Want the bot I actually run?
My BTC/USDT spot grid bot is published on BitGet. Same range, same grid count, same capital ratio I use myself.
Affiliate link. I may earn a commission at no extra cost to you.
Related posts
- My BTC/USDT Spot Bot on BitGet: Settings + Strategy
- Crypto Trading Bots: What Actually Works
- BitGet Review: The Crypto Exchange I Actually Use