I once spent two weeks backtesting a bot that returned 340% across 18 months of historical BTC data. I deployed it live with $5,000. Six weeks later I was down 12%. The bot wasn’t broken. The backtest was. I’d done what every retail trader does — tuned the parameters until the historical curve looked beautiful, deployed the optimised version live, and discovered I’d been fitting to noise.
Backtesting is essential. It’s also one of the easiest ways to lie to yourself with maths. This post is how to do it honestly — the tools, the traps, and the process that’s stopped me from making that same mistake twice. Some links here are affiliate. I’ll flag them.
Short answer: Backtesting runs a bot’s rules against historical price data to estimate how it would have performed. Done honestly, it’s a sanity check before deploying real capital. Done badly, it produces beautiful curves that fall apart live. The defence is walk-forward testing, out-of-sample validation, conservative fee assumptions, and a minimum 12-month live paper trade before scaling. Most retail backtests fail because the operator overfits parameters to the historical data.
Test on BitGet bot copy first → (affiliate)
Key takeaways
- Backtesting estimates historical performance; it doesn’t predict future performance.
- The four biggest traps: overfitting, look-ahead bias, survivorship bias, unrealistic fees.
- Always test on out-of-sample data the bot wasn’t tuned on.
- Use walk-forward optimisation to simulate real deployment conditions.
- Add a 0.5% fee + slippage buffer to every backtest. Real fills cost more than displayed prices.
- Paper trade live for 2–4 weeks before committing real capital.
- The “what would I do live” test catches most overfit strategies.
What backtesting actually is
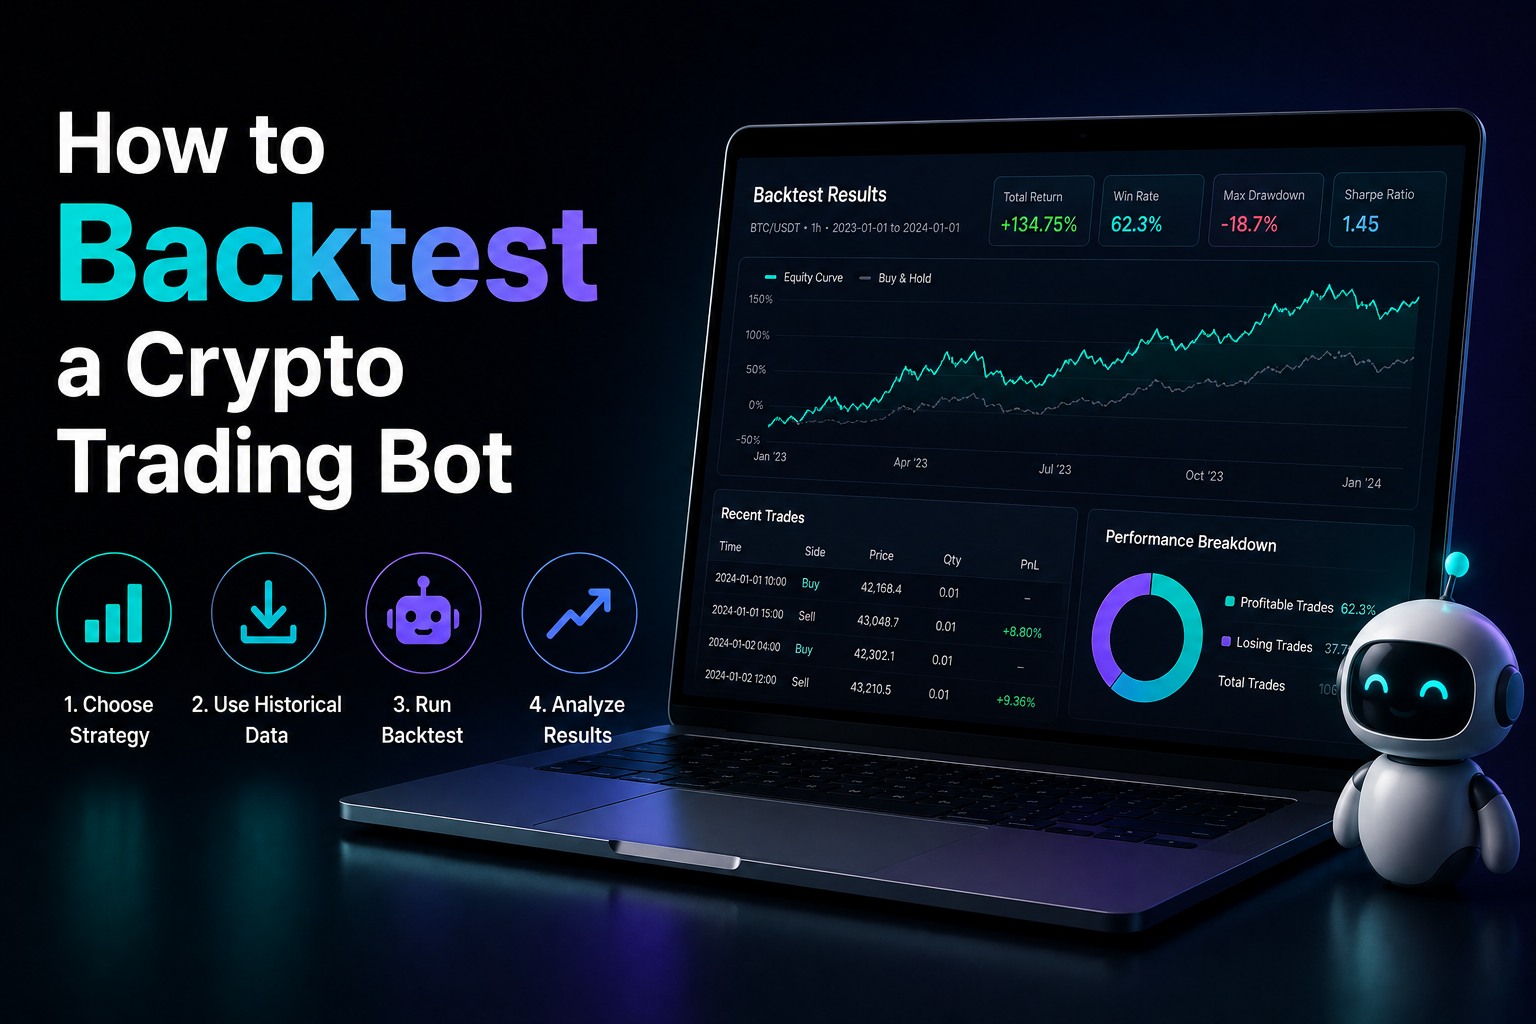
Backtesting is running a bot’s rules against historical price data to simulate what the bot would have done. You pick a date range, feed the bot the historical chart, and watch the simulated PnL output.
The output usually includes:
- Total return across the period
- Maximum drawdown
- Win rate (% of profitable trades)
- Number of trades
- Average win vs average loss
- Sharpe ratio (return per unit of risk)
A passing backtest shows the strategy would have worked on past data. That’s not the same as showing it will work on future data. The gap between those two things is where most retail traders lose money.
Why backtest at all
If backtests are so unreliable, why bother? Because a strategy that can’t make money against the last 12 months of data definitely won’t make money against the next 12. A failed backtest kills bad strategies before they cost you live capital.
The backtest is a filter, not a forecast. Use it to eliminate the obvious losers. Don’t trust it to predict the winners.
What backtests can’t tell you
- Whether the future market regime will match the historical one.
- Whether your fee assumptions match real fills.
- Whether you’ll have the discipline to run the strategy through its drawdowns.
- Whether slippage on the actual pair you trade will eat your edge.
Those are the things that decide whether you make money live. The backtest is silent on all of them.
Why most backtests are lies
Four traps account for almost every blown-up bot in retail. If you avoid all four, you’re already in the top decile of backtesters.
Overfitting (curve-fitting)
You tweak the bot’s parameters until the historical curve looks great. You ship it. Live performance is nothing like the backtest.
The cause: you optimised for noise in the historical data, not for the underlying strategy. The 14-day EMA crossed the 38-day at exactly the right times in 2024 — but only by accident. The same setup on the next 12 months of data is random.
The defence: limit yourself to tuning 2–3 parameters max. Always validate on data the parameters weren’t tuned on (out-of-sample testing). If the strategy doesn’t survive that validation, it’s overfit.
Look-ahead bias
The bot uses information it couldn’t have known at the time. Common examples:
- Calculating a moving average using today’s close to decide today’s trade — but you only know today’s close at the end of the day.
- Using future price action to filter trades — “buy only if the price was up 10% in the next 24 hours” is not a strategy you can execute live.
- Using survivor data — backtesting on tokens that exist now, which excludes the tokens that went to zero in the period.
The defence: read your bot code carefully. Every data point used to make a decision must have been available at that timestamp in real time.
Survivorship bias
The pairs in the backtest still exist. The ones that delisted or went to zero don’t show up in your data. The strategy that “worked” across the last 5 years on the top 20 tokens worked on the survivors. The dead tokens aren’t in the sample.
The defence: include delisted pairs if your tool supports it. Or restrict your bot to BTC and ETH (which haven’t delisted) and accept the narrower universe.
Unrealistic fees and slippage
Most backtest tools assume zero slippage and a low default fee. Real fills include market impact, partial fills, and fee tiers above the default.
The defence: add a fee assumption higher than the actual rate. I use 0.15% per side as a baseline against actual fees of 0.10% — that 0.05% buffer catches slippage and any miscellaneous costs. If the strategy survives that, it’ll probably survive live.
The 3 questions every backtest must answer
Before deploying any bot, the backtest needs to answer these three.
1. Does the strategy beat hold-spot on the same period?
If you’d just held BTC for the same window, what return would you have? The bot needs to beat that, or beat it on a risk-adjusted basis (lower drawdown for similar return).
A bot that returned 12% while BTC returned 80% on the same period isn’t a profitable strategy — it’s an underperformance machine.
2. Does it work in multiple market regimes?
Test across at least one bull leg, one bear leg, and one ranging period. A bot that printed 200% in the 2021 bull run but lost 40% in the 2022 collapse has a regime-specific edge, not a real one.
The honest bots win modestly in their preferred regime and avoid catastrophic losses in the others.
3. What’s the maximum drawdown, and could you sit through it?
A 35% drawdown looks fine on paper. Sitting through a 35% drawdown on real capital is psychologically brutal. If the backtest shows a 35% drawdown, assume you’ll turn the bot off at 20% — and then plan accordingly.
The defence: only deploy strategies whose maximum drawdown is something you’d realistically tolerate, not the maximum your numerical pain tolerance says.
Tools to use
There’s a spectrum from “free and simple” to “powerful and complex”. Pick the lowest tool that does what you need.
TradingView Pine Script
The default tool for most retail traders. Free tier works for basic strategies. Pine Script is a simple language designed for backtesting trading strategies. The built-in backtest engine shows PnL, win rate, drawdown, and trade-by-trade output on any chart.
Strengths: free, fast, visual, huge community of shared strategies.
Weaknesses: limited to single-pair backtests, can’t easily test across many assets, less reliable for high-frequency strategies.
Best for: rule-based bots with clear entry/exit conditions.
Python + ccxt
The pro-retail tool. ccxt is an open-source Python library that connects to most major exchanges including BitGet for historical data pulls. You write the bot logic in Python, pull historical OHLCV data via ccxt, run your strategy against it.
Strengths: full control, multi-pair, multi-exchange, scales to ML-based strategies.
Weaknesses: requires coding skills, more time investment, easier to make subtle bugs.
Best for: anyone who can write Python and wants serious backtesting flexibility.
Backtrader (Python framework)
A more structured Python framework for backtesting. Handles many of the boilerplate problems (order matching, slippage modelling, position tracking) so you can focus on strategy logic.
Strengths: realistic order simulation, good documentation, active community.
Weaknesses: still requires Python, learning curve for the framework.
Best for: intermediate Python users moving up from TradingView.
3Commas paper trading
3Commas has a paper trading mode where the bot runs against live market data without committing real capital. Not a true backtest (you can’t replay history), but the next-best thing for validating a bot’s behaviour live.
Strengths: real market conditions, real fees applied, real fills.
Weaknesses: takes real time (4 weeks of paper trading = 4 actual weeks), 3Commas subscription cost.
Best for: validating a bot’s behaviour in current market conditions before committing capital.
Native exchange backtesting
BitGet’s bot interface includes a basic backtester that shows simulated returns for grid and DCA configurations. Limited but useful for quick sanity checks before deployment.
Strengths: zero setup, integrated with the actual bot you’ll run.
Weaknesses: limited customisation, basic fee modelling.
Best for: confirming a configuration looks reasonable before going live.
Walk-forward optimisation explained
This is the single most important technique that retail traders skip.
The problem with simple backtesting
You tune the bot’s parameters on 12 months of data. The backtest shows 40% returns. You deploy live. The bot returns 5%. The reason: the parameters were tuned to that specific 12-month window’s noise, not to anything that generalises.
How walk-forward fixes it
Walk-forward optimisation splits the historical period into chunks. You tune on the first chunk, validate on the next, then “walk” forward through time, re-tuning periodically.
Example with 24 months of data:
- Months 1–6: tune parameters here (in-sample)
- Months 7–9: test the tuned parameters here (out-of-sample). Don’t tune anything based on this period.
- Months 7–12: re-tune parameters using months 1–12.
- Months 13–15: test again on out-of-sample.
- Repeat through the data.
The result is a simulation that more closely matches what you’d actually do in live trading — re-tune periodically based on recent data, then run the tuned strategy on the next period.
What the output tells you
If the strategy’s out-of-sample performance is consistently good across multiple walk-forward windows, the strategy probably has real edge. If the in-sample backtest looks great but the out-of-sample tests are mediocre, the strategy is over-fit — it works on the period it was tuned on and falls apart on new data.
Walk-forward is more work. It’s also the single biggest filter against deploying garbage strategies.
Out-of-sample testing
A simplified version of walk-forward for when you don’t want to write the full framework.
The basic version
Split your historical data 70/30:
- 70% in-sample: the period you tune parameters on.
- 30% out-of-sample: the period you only run the final tuned strategy against.
If the strategy looks great on the in-sample 70% and falls apart on the out-of-sample 30%, it’s overfit. Don’t deploy.
If it performs reasonably on both, you have more confidence — but you still need paper trading before live capital.
Why the 30% holdout matters
The temptation is to keep tweaking until both halves look good. Don’t. The moment you tweak based on out-of-sample performance, you’ve contaminated the out-of-sample test. The validity of the test depends on you not looking at the result until you’ve finalised the strategy.
This requires discipline. Set the holdout period, finalise the strategy on the in-sample data, then run the holdout test exactly once. Whatever the result is, that’s your answer.
Multiple holdout periods
For higher confidence, pick multiple out-of-sample windows across different market conditions. A strategy that survives a bull window, a bear window, and a ranging window is more likely to survive whatever the future brings.
How long a backtest period to use
There’s a real trade-off here.
Too short
12 months or less. Includes too few market conditions. The strategy might have benefited from one specific regime that doesn’t repeat. False confidence in the results.
Too long
5+ years. Includes regimes that may no longer apply (the 2017 ICO boom, the early DeFi era). The market structure has shifted multiple times. A strategy that worked across 2017–2022 might have only worked because of fundamentally different market conditions in each period.
The right length
24–36 months is the sweet spot for most strategies. Long enough to include multiple market conditions. Short enough that the market structure is reasonably consistent.
For BTC and ETH specifically, you can go longer because the assets are mature. For newer alts, 12–18 months is often all the relevant data you have.
What to look for in the data
The 24-month period should ideally include:
- At least one clear uptrend
- At least one clear downtrend
- At least one extended ranging period
- At least one major volatility event (sudden crash or pump)
If your data lacks any of these, your backtest is incomplete. The strategy hasn’t been tested against the full range of conditions it’ll meet live.
CoinGecko historical data is the standard source for BTC price history that I use for manual checks.
Fee + slippage modelling: the 0.5% rule
This is where most backtests quietly lie.
What most backtest tools do
They assume a default fee (often 0.10%) and zero slippage. The bot fills at the displayed price every time. The PnL looks great.
What actually happens live
- Your maker order doesn’t always fill at the maker rate — sometimes it converts to taker if the price moves.
- Slippage on order book imbalances, even small ones, costs basis points.
- Fees on certain pairs or under certain conditions are higher than the default.
The cumulative effect is the difference between a 25% backtest return and a 14% live return on the same strategy.
The 0.5% rule
Add 0.5% to your round-trip fee assumption in the backtest. If actual round-trip fees are 0.20% on BitGet, model 0.70% in the backtest. The 0.5% buffer absorbs slippage, fill variance, and your underestimation of taker conversion.
If the strategy still shows positive returns after the buffer, it has a real edge. If the buffer eliminates the edge, the strategy is too marginal to deploy.
BitGet’s fee schedule gives you the real numbers to work with. Pair this with a buffer.
Volume matters
For high-volume pairs like BTC/USDT, slippage is typically negligible. For low-volume alts, slippage can exceed fees. Stick to majors and the buffer requirement is easier to meet.
The “what would I do live” test
This is the cheapest, most valuable backtest you can run. It’s not a numerical test. It’s a human one.
The test
Read your bot’s rules. Imagine running them yourself, manually, for 30 days. Picture executing every entry and exit by hand.
- Would you have the discipline to fire the 3am buy when the chart is bleeding?
- Would you sit through the 18% drawdown without intervening?
- Would you trust the strategy when it underperforms a held BTC position for 6 weeks?
- Would you stop tweaking the parameters?
If the honest answer to any of these is “no”, the bot won’t work live no matter what the backtest says. You’ll override the strategy at the worst possible moment.
The fix
If you can’t sit through the strategy manually, redesign it to something you can. Smaller positions. Wider stop losses. Less frequent trades. Whatever makes the strategy compatible with your tolerance.
The best backtest in the world doesn’t help if you turn the bot off at the bottom of every drawdown. Match the strategy to the operator.
If you want to build the discipline to actually run systematic strategies — not just backtest them — the community I’m part of for this is Trade Travel Chill (affiliate). Education-focused, systematic-strategy-friendly. The closest thing I’ve found to a real ongoing tutorial in this stuff.
BitGet paper trading walkthrough
Before deploying any real capital, run the bot in paper trading for at least 2 weeks. Here’s how on BitGet.
Step 1: Open the bot configuration
Navigate to Trading Bots in your BitGet account. Pick the bot type (grid, DCA, etc.). Configure the same parameters you’d use live.
Step 2: Use the simulation mode
BitGet’s native bot interface includes a simulation/backtest preview that shows expected behaviour on recent historical data. This isn’t the same as live paper trading, but it’s a fast sanity check.
Step 3: Deploy with a tiny live allocation
The closest thing to true paper trading on BitGet (without using a third-party tool) is deploying the bot with a tiny real allocation — say $50 or $100. The bot runs against live market conditions with real fills. You see how it behaves, how the orders fill, what the actual fee impact is.
This is paper trading with the realism dial turned up. The cost is the small real capital at risk, plus the small fees. The benefit is you see real fills, not simulated ones.
Step 4: Run for at least 2 weeks
Two weeks is enough to see the bot through a typical chop period and at least one minor directional move. Watch:
- How does the bot behave in a fast move?
- Do fills land where the backtest said they would?
- Are the fees what you expected?
- Does the PnL track the live market in a way you understand?
Step 5: Scale up only after the test
If the 2-week mini-deployment behaves as expected, scale to your full intended allocation. If it doesn’t, figure out why before scaling. The cost of finding out at $100 is one cup of coffee. The cost of finding out at $5,000 is a month’s grocery bill.
The detailed walkthrough is in the BitGet BTC/USDT spot bot post.
Skip the backtest — copy a live-tested bot.
My BTC/USDT spot grid is published on the BitGet bot marketplace with a real live track record. Two-click deployment.
Affiliate link. I may earn a commission at no extra cost to you.
The full process I follow
End-to-end, here’s the workflow before any bot gets real capital.
- Define the strategy in plain English. One sentence. If I can’t, the strategy isn’t well-formed.
- Pick the universe. BTC/USDT or ETH/USDT 95% of the time. Liquidity matters.
- Backtest in TradingView or Python over 24 months with conservative fees (0.5% round-trip buffer over actual).
- Run walk-forward optimisation — tune on first half, validate on second half.
- Check the 3 questions: beats hold-spot, works across regimes, drawdown tolerable.
- Run the “what would I do live” test. Honest check on whether I can sit through the strategy.
- Deploy with $50–$100 live for 2 weeks. Real fills, real fees, real behaviour.
- Scale up incrementally if step 7 matches expectations. Never deploy full allocation on day one.
- Review monthly. Live performance vs expected. Adjust if regime shifts.
- Tax provisioning monthly. Export CSVs, import to Koinly or CoinTracker.
Most strategies die at step 5 or 6. That’s the point of the process. The ones that survive are the ones worth deploying.
Security on backtesting infrastructure
If you’re using third-party tools or running your own Python infrastructure, the security stack matters.
- Read-only API keys for backtesting. Never give a backtest tool trade permissions. Read-only is enough for historical data pulls.
- Separate API keys for live trading. Issue a different key with whitelist restrictions for the bot that actually trades.
- VPN on any infrastructure that touches your exchange account. I use NordVPN (affiliate) on every device that hits a trading API.
- No production secrets in repos. If you’re writing Python, never commit API keys to GitHub even private repos.
A compromised backtest infrastructure can be the entry point for an account takeover even if the backtest itself only had read permissions.
Ready to deploy?
If the backtest checks out, BitGet’s bot suite is where I run mine. Native, low-fee, integrated paper trading. Two-click deployment.
Affiliate link.
Frequently asked questions
What is backtesting a trading bot?
Backtesting runs a bot’s rules against historical price data to simulate how the bot would have performed. It’s a sanity check before deploying real capital, not a forecast.
How accurate are backtests?
Done honestly, they give you a reasonable estimate of how the strategy would have performed in past conditions. They don’t predict future performance and often overstate it due to overfitting, look-ahead bias, and unrealistic fee assumptions.
What is overfitting in backtesting?
Tuning the bot’s parameters until the historical curve looks great, only to discover the optimisation was for noise rather than signal. The defence is limiting parameter tweaks and validating on out-of-sample data.
What is walk-forward optimisation?
A technique that splits historical data into chunks, tunes parameters on each chunk, then validates on the next chunk. Simulates real deployment conditions and produces more reliable performance estimates than single-period backtests.
What is look-ahead bias?
When the bot uses information that wasn’t available at the trade timestamp in real time. Common example: using today’s close to decide today’s trade. The defence is careful code review.
How long should the backtest period be?
24-36 months is the sweet spot. Long enough to include multiple market conditions, short enough that the market structure is reasonably consistent. For newer alts, 12-18 months is often all the relevant data available.
What tools should I use to backtest?
TradingView Pine Script for simple strategies, Python plus ccxt for serious flexibility, Backtrader for structured Python work, 3Commas for paper trading on live data, or BitGet’s native interface for quick sanity checks.
Do I need to be able to code to backtest a bot?
No for simple checks — TradingView’s interface handles basic backtests visually. Yes for serious work — Python plus ccxt is the standard tool for multi-pair, multi-condition backtesting.
Final word
A backtest is a filter, not a forecast. It kills the obvious losers and gives you a basic read on whether a strategy has any hope of working. It doesn’t tell you whether the strategy will actually make money live.
Here’s what I actually do:
- Strategy defined in one English sentence.
- 24-month backtest with conservative fees and walk-forward validation.
- The 3-question check: beats hold-spot, works across regimes, tolerable drawdown.
- 2 weeks live with $100 to see real fills and real behaviour.
- Scale up only after step 4 confirms the strategy works in real conditions.
- Monthly review on live performance. Cut if it drifts from expected.
The bots that survive this process aren’t the ones with the prettiest backtests. They’re the ones with modest, consistent edges that hold up in real conditions. Boring is the goal. The exciting ones blow up.
Right — over to you.
Related posts
- Crypto Trading Bots: What Actually Works
- Are Crypto Trading Bots Profitable?
- Grid Trading Explained
- DCA Bots: The Lazy Trader’s Edge
- BitGet BTC/USDT Spot Bot: My Settings
External references
- Investopedia — Backtesting explained
- CoinGecko — Bitcoin historical price data
- ccxt — Open-source crypto trading library on GitHub
- BitGet — Trading bot documentation
- BitGet — Spot fee schedule