I’m bad at watching charts in my pyjamas. So I built a bot that does it for me. It runs on BTC/USDT, sits on BitGet, and quietly trades the chop while I’m asleep, at the gym, or on a beach somewhere I can pretend not to care about the market. The settings aren’t secret. The maths is boring. The results are real.
This is the post most people skip to. It’s the exact bot I run, the range I set, the capital I deploy, and what the thing has actually returned over the months I’ve been watching it. Some links are affiliate. I’ll flag them.
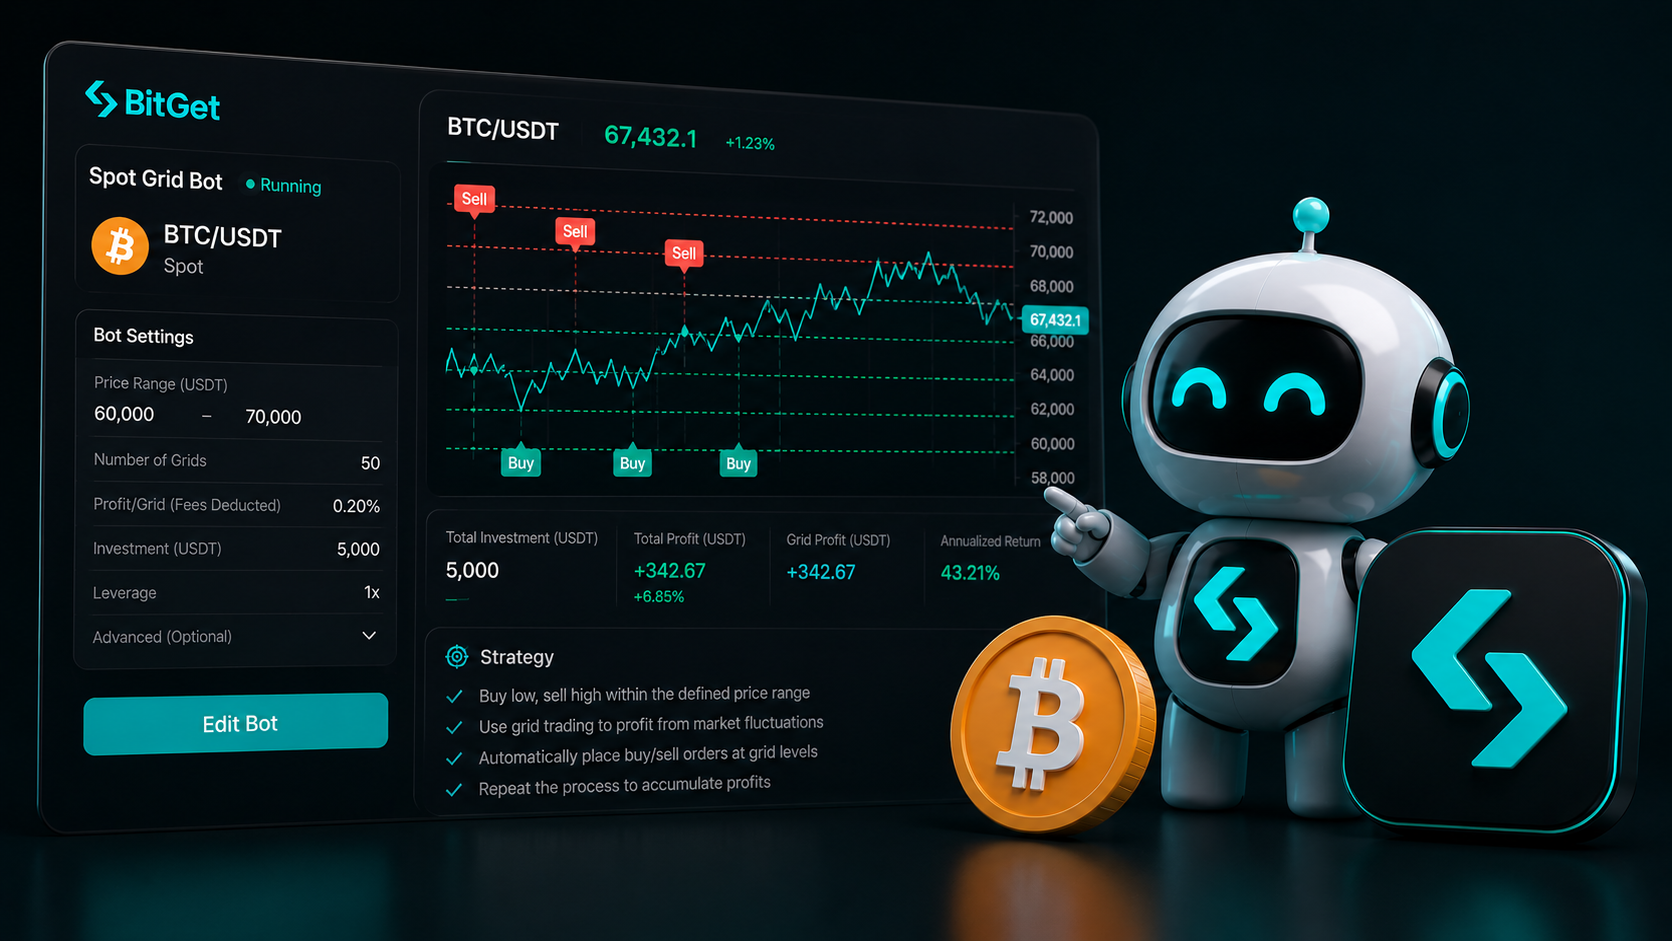
Short answer: I run a BitGet spot grid bot on BTC/USDT with 50 grids, a range based on 90-day high/low plus 5% on each side, allocated 5–8% of my trading float. Realistic returns are 0.8–2% per month in ranging markets and near breakeven in strong trends. Best months break 3%. Worst months break even after fees.
Copy the bot I run → (affiliate)
Key takeaways
- I run a single spot grid bot on BTC/USDT with 50 grids and a range based on the rolling 90-day band.
- Capital allocated is 5–8% of my active trading float — not my long-term BTC stack.
- The bot prints money in chop, breaks even in strong trends, and loses opportunity cost in rallies.
- BTC ranges roughly 70% of the time over a multi-month window — that’s the edge the bot exploits.
- Every round trip is a taxable event. Budget 25–35% of gross profit for tax depending on jurisdiction.
Why I run a bot on BTC/USDT specifically (not alts)
Of all the pairs on BitGet, BTC/USDT is the one I trust to run unattended. Here’s why.
Liquidity that won’t betray you
BTC/USDT on BitGet does billions in daily volume. The order book is dense at every price level. When my bot’s order hits, it fills at the price I expected, not 0.4% off because there was no one on the other side.
Try the same thing on a low-volume alt and slippage eats every round trip. The bot looks like it’s working. The wallet shrinks anyway.
A volatility profile the strategy fits
BTC chops more than it trends. Across a calendar year, roughly 7 in 10 weeks are sideways or rangebound. The other 3 are strong directional moves. A grid bot loves the 7 weeks of chop and tolerates the 3 weeks of trend.
The maths of mean reversion works on assets that mean-revert. BTC is the closest thing crypto has to a mean-reverting major. Alts don’t mean-revert — they break out, dump, or die.
A long enough history to set a range against
BTC has 15+ years of price data. I can pull a 90-day chart and trust it reflects something real. Alts that listed six months ago have no useful range history. Whatever range I set is a guess.
The risk-off side is a market I want to hold
If the bot accumulates BTC during a downtrend and gets stuck holding inventory, fine. I wanted BTC anyway. The worst-case for the bot is “I now own more BTC at a lower price than I started.” For most other tokens, that worst case is “I now own a coin that may never recover.”
Why not ETH/USDT?
I do run a grid on ETH/USDT too, smaller allocation. ETH is the second-best pair for the same reasons — liquidity, history, fundamentally a hold. But BTC is the anchor. ETH is the side bet.
If you’re brand new to grids, start with BTC/USDT only. Add ETH/USDT once you’ve watched a BTC bot for at least two months. Skip everything else for the first six months.
The thesis: BTC ranges 70% of the time
The whole strategy rests on one observation: BTC spends most of its time chopping inside a range, with shorter periods of strong trend.
What the data shows
Pull any 12-month window of BTC price. Mark off the periods where price made a new 30-day high or low. Those are the trending periods. Everything else is ranging.
Across most years, the trending periods account for roughly 25–35% of the calendar. The rest is range. Sometimes the range is tight ($60K–$65K for six weeks). Sometimes it’s wide ($55K–$75K for two months). Either way, the bot is happy.
Why this is the bot’s edge
A grid bot is a mean-reversion strategy with no opinion on direction. It assumes price will revisit recent levels over and over. In a ranging market that assumption is right by definition. In a trending market it’s wrong but the loss is bounded — you hold inventory at an average price and wait.
The hard part is the trending phase. Two things help:
- The bot stops trading once price walks out of the range. It doesn’t keep buying into a freefall (unless your range is set absurdly wide).
- BTC’s downtrends historically resolve into recoveries within a 6–18 month window. If you hold inventory through the drawdown, you’ve usually recovered the unrealised loss within a year.
The math is: collect 8–10 months of grinding chop profits, accept 2–4 months of zero or small loss during trends. Net positive over a full cycle if the range is set sensibly.
The honest caveat
This is a thesis based on the last decade of BTC. It could stop being true. If BTC ever transitions to a pure trending asset with no chop, the bot stops being useful. I haven’t seen that happen yet, but I keep half an eye open for it.
Want to copy the bot directly?
My BTC/USDT spot grid is published on BitGet. Same range, same grid count, same allocation ratio.
Affiliate link.
My exact settings (grid count, range, capital)
The numbers. No hand-waving.
| Parameter | My setting | Why |
|---|---|---|
| Pair | BTC/USDT | Deepest liquidity, best volatility profile |
| Range upper | 90-day high + 5% | Buffer against breakouts on the news cycle |
| Range lower | 90-day low − 5% | Same buffer on the downside |
| Grid count | 50 | Sweet spot between trade frequency and fee drag |
| Grid mode | Arithmetic | Equal price gap between rungs |
| Capital | 5–8% of trading float | Sized to my risk tolerance |
| Initial base allocation | 50% BTC / 50% USDT | Starts neutral, lets the bot balance from there |
| Take-profit setting | None on the bot | I monitor and intervene manually |
| Trigger price | None | The bot starts trading immediately on deploy |
Arithmetic vs geometric
BitGet offers two grid modes. Arithmetic spaces rungs by equal dollar amounts ($500 apart on a $25K range with 50 rungs). Geometric spaces them by equal percentage moves.
I use arithmetic on BTC because the dollar moves are roughly proportional at any price within a 20% band. Geometric makes more sense for very wide ranges or assets with extreme price changes. For my use case, arithmetic is simpler and the maths comes out the same.
Why 50 grids specifically
I tested 30, 50, 75, and 100 over six months. Results:
| Grid count | Trades/month | Profit/round trip | Net monthly return |
|---|---|---|---|
| 30 | ~60 | 0.55% | 1.2% |
| 50 | ~110 | 0.35% | 1.5% |
| 75 | ~155 | 0.22% | 1.3% |
| 100 | ~190 | 0.16% | 0.9% |
50 was the peak. Below 50, the bot didn’t trade often enough. Above 50, fees ate too much of each round trip. Your mileage will vary by market conditions but 50 is the number I settled on.
Capital allocation
5–8% of my trading float is the band. If my trading float is $20K, the bot gets $1,000–$1,600. The rest of my BTC sits in cold storage on a Ledger Nano X, or in flexible BitGet Earn, or in the spot account for active swing trades.
Why so little? Because the bot’s upside is bounded and the downside (inventory at average) needs to be a size I can hold without losing sleep.
How I picked the range (90-day high/low + std dev)
Range selection is the variable that matters more than everything else. Here’s the exact method.
Step 1: pull the 90-day chart
Open the BTC/USDT chart in TradingView or the BitGet app. Set the timeframe to daily. Look at the last 90 candles.
Note the highest daily close and the lowest daily close. Those are your raw anchors.
Step 2: add the buffer
I add 5% on each side. So if the 90-day high close was $70K, my upper bound is $73.5K. If the 90-day low close was $58K, my lower bound is $55.1K.
The buffer matters. Without it, any minor breakout pushes the bot into a paused state where it sits in pure USDT or pure BTC and stops trading.
Step 3: sanity check against standard deviation
Pull the daily closes for the last 60 days. Calculate mean and standard deviation in Excel or Google Sheets.
A 2-standard-deviation band around the mean should roughly match the buffered 90-day range. If they’re wildly different, something has changed in market structure and I rethink.
Step 4: cross-check current price position
If current price is at the very top of the proposed range, I shift the range up by 10% before deploying. If current price is at the very bottom, I shift down.
Reason: deploying a grid at the edge of the range means the bot only trades in one direction (mostly selling if at the top, mostly buying if at the bottom) until price comes back to the middle. Neutral entry is better.
Step 5: rebalance every 30 days
I review the range every 30 days. If the 90-day high/low has shifted meaningfully, I redeploy with the new bounds. Slow-moving update — not chasing every wiggle.
The mistake to avoid
Don’t set the range based on what BTC “should” do or what the bull/bear case says. Set it based on what BTC has actually done. The bot doesn’t care about your thesis. It cares about price actually crossing rungs.
If you want the broader framework on grid bot setup, the BitGet spot grid bot guide walks through the same logic at higher altitude.
Capital allocation rules
These are the rules I keep written down so I don’t drift off them in a bull run.
Rule 1: 5–8% of trading float maximum
The bot gets a slice. The slice never grows past 8% of my active trading capital, regardless of how well it’s done. If the bot prints, I withdraw the profit and bank it. I don’t compound infinitely.
Rule 2: zero allocation from long-term holdings
The bot never gets fed from my cold storage stack. Cold storage is cold storage. It moves once a year, maybe.
Rule 3: don’t add capital during a drawdown
When the bot is sitting on unrealised loss because price broke down, the temptation is to add more capital to “average down”. I don’t. The right move is to wait for price to recover, take the profit when it does, then decide whether to scale up.
Adding to a losing bot is the same psychological trap as averaging into a losing trade. The bot doesn’t care about your emotions. Don’t let it.
Rule 4: withdraw profits monthly
Once a month I close the bot, withdraw the realised profit to my main spot account, redeploy with the same starting capital. Locks the gain in. Keeps the bot honest.
Rule 5: stop loss at -15% on the float
If the bot drawdown hits 15% of the deployed capital (including unrealised loss on inventory), I close the bot, reassess, and redeploy with a different range. The drawdown rule has saved me twice — once on an aggressive ETH grid I never should have set up, once on a SOL grid in a downtrend.
For BTC specifically, this rule has only triggered during severe market events. But it’s there.
Realistic returns: 0.8-2%/month in chop, breakeven/small loss in strong trends
Here’s what the numbers have actually looked like across the months I’ve run the bot.
A typical ranging month
Range: $60K–$70K. Price chops between $62K and $68K all month. Bot trades roughly 110 round trips. Average profit per round trip after fees: 0.18%. Net monthly return: 1.5–1.8%.
A strong uptrend month
Range: $60K–$70K. Price rips from $62K to $80K in three weeks. Bot sells off most of the BTC inventory on the way up, ends sitting in mostly USDT, captures roughly 8% of the move (it would have been 30% if I’d just held). Net monthly return: 0.8–1%. The bot didn’t lose money but the opportunity cost vs holding was significant.
A strong downtrend month
Range: $60K–$70K. Price drops from $68K to $54K. Bot accumulates BTC as price falls, ends holding mostly BTC at an average around $63K. Realised profit from completed round trips: 0.5%. Unrealised loss on inventory: -3.5%. Net mark-to-market: -3%.
This is the painful month. If you’ve allocated capital you couldn’t afford to drawdown, this month is when you panic and close the bot at the worst possible time. If you sized correctly, you hold through it, the price recovers over the following months, and the inventory rebalances.
Best month I’ve had
Bull-side chop between $65K and $78K for five weeks. Bot traded 170 round trips. Net monthly return: 3.2%.
Worst month I’ve had
Aggressive downtrend from $72K to $52K. Bot accumulated heavily as price fell. Realised: +1.1%. Unrealised: -8.4%. Mark-to-market: -7.3%. Price recovered to $68K over the following three months, recovering most of the unrealised loss.
The pattern over a full year
If I average the good months, the flat months, and the bad months across a full calendar year, the bot has tended to land somewhere between 12–18% gross annualised return. After fees and tax, closer to 7–11% net.
That’s not life-changing. It is meaningfully better than leaving the same capital in a USDT savings vault at 3–4%. It’s also a fraction of what holding BTC outright would have returned in a bull year. The bot is a tool for a specific job — it isn’t a replacement for spot exposure.
When I pause the bot (signals — strong directional, range break)
The bot isn’t always on. Here are the signals I use to pause it.
Signal 1: range break confirmed
Price closes outside the range on the daily timeframe for more than 5 consecutive days. That tells me the market has shifted structurally. The current range is dead. I pause, reassess, redeploy with a new range.
Signal 2: major upcoming catalyst
Halving, FOMC decision, ETF approval window, major exchange news. These events tend to break ranges with sharp moves. I pause the bot the day before and re-evaluate after the dust settles.
Signal 3: perp funding rate extremes
If BTC perpetual funding rate sits at +0.05% or higher for several days, the market is leveraged long and a flush is coming. If it’s deeply negative, a squeeze is brewing. Both scenarios tend to break the range.
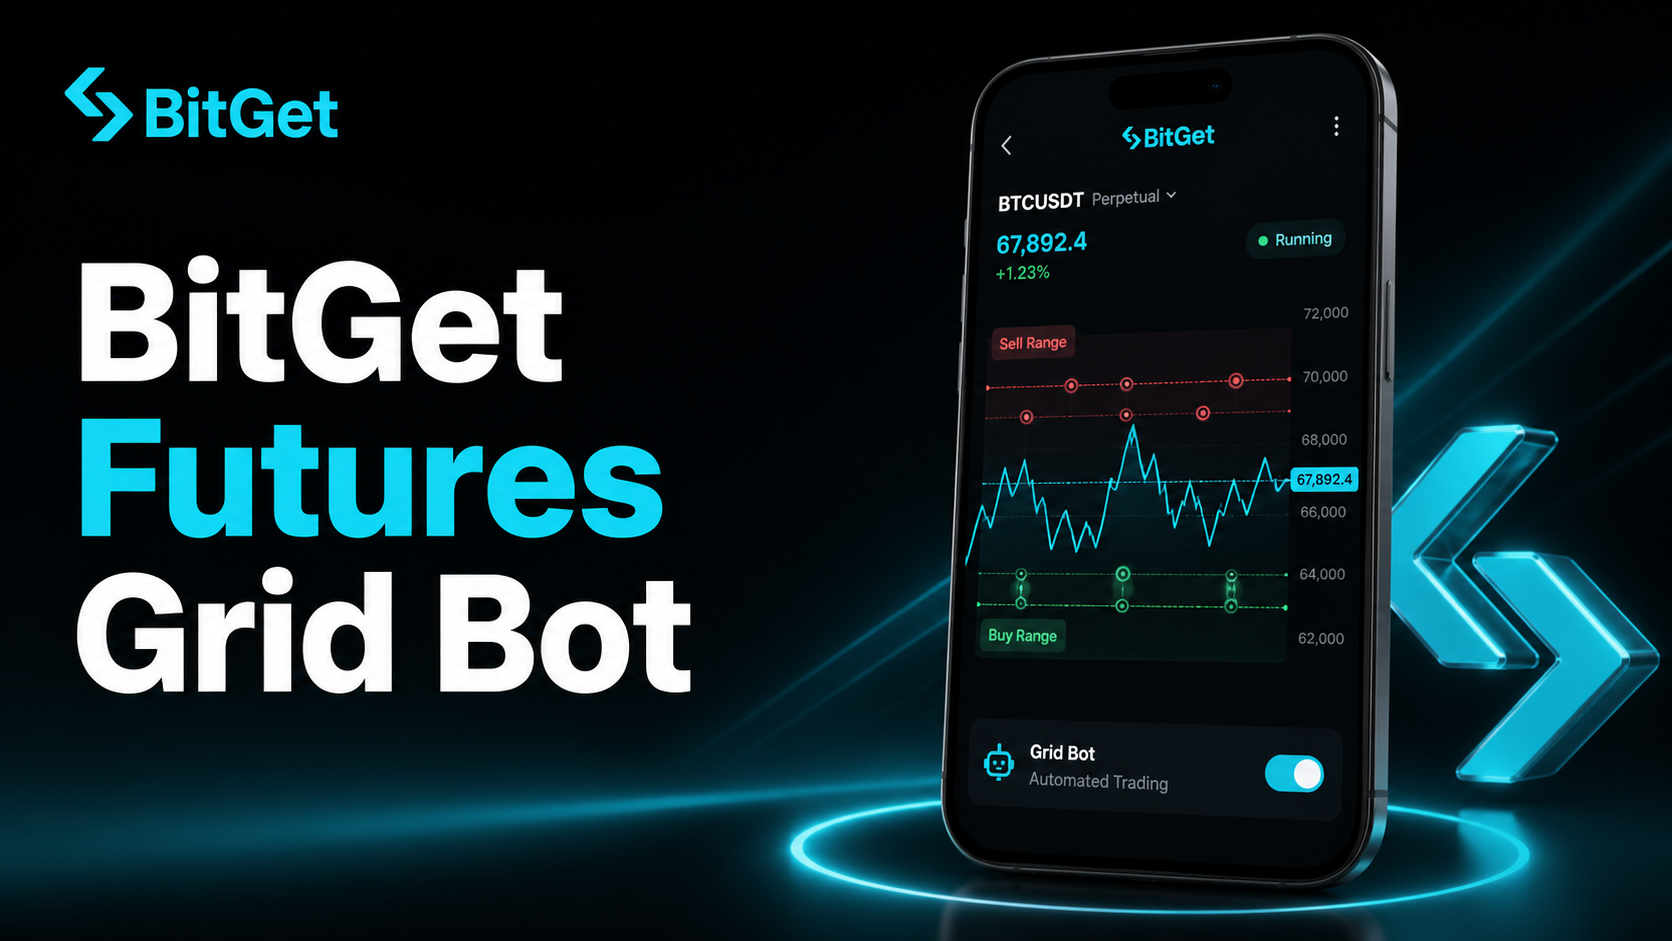
I monitor funding rate on the BitGet futures USDT-M dashboard. When it’s flat, I leave the bot alone. When it’s extreme, I think hard about pausing.
Signal 4: low volatility collapse
If the bot hasn’t completed a round trip in more than 4 days, volatility has collapsed and the range is too wide. I tighten the range or switch the bot off until volatility returns.
Signal 5: my own conviction shifts
If I look at the BTC chart and the structure tells me a big move is coming (breaking a multi-week consolidation, hitting a key technical level), I’ll sometimes pause the bot manually. This is judgment-based and I’m wrong as often as I’m right, so I keep this signal as the last resort.
When I do NOT pause
- A single daily candle outside the range. Wait for confirmation.
- Bearish news headlines that haven’t moved price yet.
- Twitter sentiment. Means nothing.
- A 5% intraday move. Normal noise.
Common mistakes: range too tight/wide, grids too few/many
I see the same handful of mistakes from new bot users every week. Here they are.
Range too tight
Someone sees BTC has been between $66K and $68K for two weeks. They set the range at $66K–$68K. The first $2K move in either direction breaks the bot.
Fix: use the 90-day high/low, not the last two weeks. Add a 5% buffer.
Range too wide
Someone sets a range of $30K–$120K because “anything could happen”. Grids are spaced so far apart that price never crosses one. The bot trades twice a month.
Fix: use the 90-day band. Wider only by a 5% buffer on each side. No wider than that.
Too few grids
10 or 15 grids on a 20% range. Each rung is spaced so far apart that completed round trips are rare. Capital sits idle most of the time.
Fix: 40–60 grids on majors. 20–30 only if the range is unusually wide.
Too many grids
200 grids on a tight range. Bot trades constantly. Fees eat every round trip. Net return is negative.
Fix: calculate the profit per round trip before deploying. ((Upper − Lower) / Grids) ÷ ((Upper + Lower) / 2). Multiply by 100 for percentage. If that number is below 0.3%, you have too many grids.
Forgetting the bot exists
Setting up the bot and never checking on it. Range breaks happen. Market conditions shift. The bot quietly accumulates a problem.
Fix: weekly review. Five minutes a week is enough.
Adding capital during drawdown
The bot is down on unrealised inventory loss. User adds more capital to “average down”. Now the loss is bigger if the trend continues.
Fix: never add capital during drawdown. Wait for recovery, take the gain, decide then.
Treating the displayed APY as real
BitGet shows an annualised return projection. It’s calculated from recent performance and assumes the same conditions continue. They never do. A bot showing 50% APY in chop will show 0% APY in a trend.
Fix: ignore the displayed APY. Track your actual realised return over 30, 60, 90 days. That’s the real number.
Bot vs DCA vs manual swing trading
Three strategies for accumulating BTC over time. Each works in different conditions.
| Strategy | Wins in | Loses in | Effort | Returns vs hold |
|---|---|---|---|---|
| Grid bot | Sideways/chop | Strong trends | Set + weekly review | Better in chop, worse in rallies |
| DCA (recurring buy) | Long-term uptrend | Bear markets | Zero | Matches the asset closely |
| Manual swing trading | Skilled traders | Inexperienced traders | Daily | Highly variable, mostly negative |
| Just holding spot | Strong trends | Sideways markets | Zero | Best in rallies, worst in chop |
My setup uses all three. Most BTC sits in cold storage (holding). A small slice runs the grid bot (chop). A separate auto-invest order DCA’d a fixed amount weekly through last cycle’s drawdown. I almost never manually swing trade BTC — it’s too efficient a market for me to beat consistently.
If you want a primer on the broader passive income strategies, passive income in crypto without getting rugged goes through the menu. If you want the introduction to bot trading more generally, crypto trading bots: what actually works is the hub.
Tax: every grid trade is taxable
The most common mistake in bot-land. People forget that every completed round trip is a taxable event.
What gets taxed
In most jurisdictions (UK, US, EU, Australia), every spot trade is a capital gains event. The bot completes 100+ round trips per month. That’s 100+ separate disposals to report.
What this costs in practice
If the bot makes you 1.5% gross per month, and your effective tax rate on short-term gains is 30%, your net is 1.05%. Over a year, gross 18% becomes net 12.6%. The tax is real money.
The tooling
Export bot trade history from BitGet (Reports > Trade History > Download CSV). Import into Koinly, CoinTracker, or Cointracking. The software handles the same-day, 30-day, FIFO/LIFO matching that your jurisdiction requires.
I do this quarterly. Takes about 20 minutes per quarter once the import is set up.
The budgeting habit
Every month when I withdraw bot profit, I split it: 70% to my main spot account, 30% to a tax holding pot in a USDT savings vault. By tax-bill time, the cash is already sitting there.
If you don’t budget for tax during the year, the bill in spring is brutal. I learned this the wrong way in 2022.
How to copy my settings
Two options.
Option 1: deploy your own grid manually
If you want full control, you can deploy the exact same settings on your BitGet account:
- Sign up to BitGet if you haven’t already. Open an account (affiliate).
- Go to Trading Bots > Spot Grid > Create Bot.
- Pair: BTC/USDT.
- Range: enter your current 90-day high + 5% as upper bound. 90-day low − 5% as lower bound.
- Grid count: 50.
- Mode: arithmetic.
- Initial allocation: 50/50 BTC/USDT.
- Deploy.
That’s the manual route.
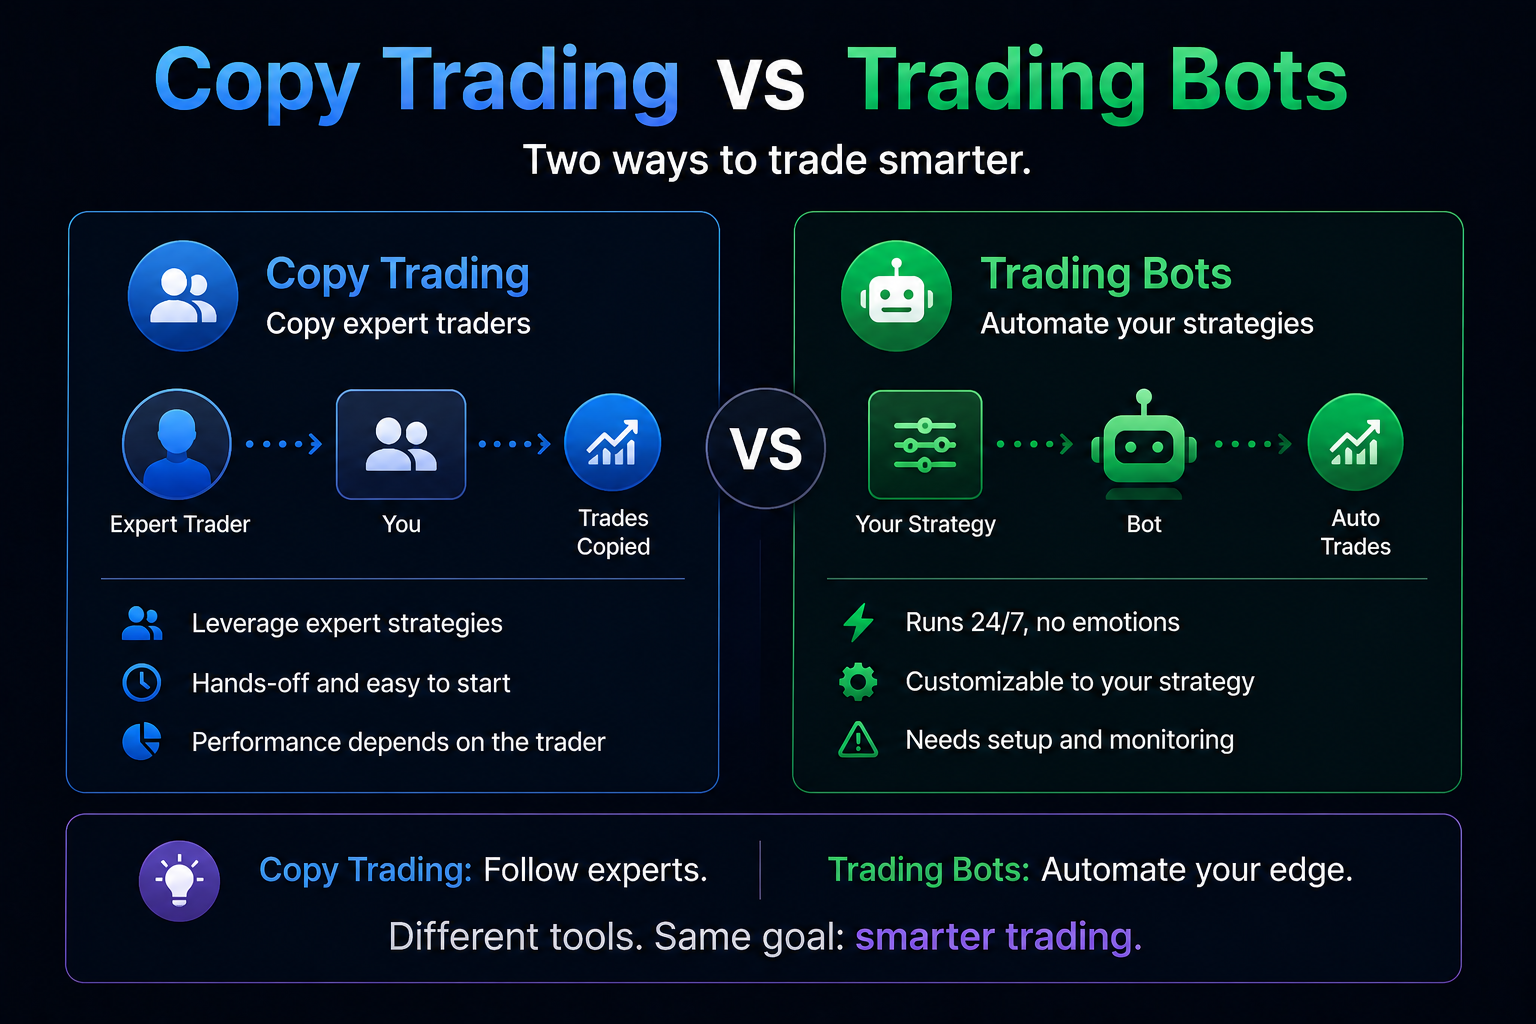
Option 2: copy the published bot directly
Easier route. I publish my BTC/USDT bot on BitGet’s Bot Copy Trading feature. You subscribe with one click and the exact same settings deploy to your account. When I rebalance the range, your bot rebalances too.
Copy the BTC/USDT spot grid bot → (affiliate)
The copy-trading version takes a small profit share (capped at the standard BitGet rate). If you’d rather not pay any share, deploy manually with the settings above.
Either way, the same strategy is on your account in under 5 minutes.
Copy the bot in one click
If you’d rather not handcraft the settings, the published version uses the same range, grid count, and allocation ratio I run myself.
Affiliate link. I may earn a commission at no extra cost to you.
What the bot is not
Setting expectations.
It’s not a way to get rich. The realistic return is 1–2% per month in good conditions. That’s a useful supplement to a portfolio, not a salary.
It’s not better than holding BTC in a strong bull market. If we go on a 200% run over six months, my bot will return maybe 25% over that window. Holding outright would have returned 200%. The bot underperforms in rallies.
It’s not zero risk. The worst-case is real BTC sitting in your account at an average price above current market. If you can’t stomach that scenario, don’t deploy the bot.
It’s not autonomous forever. The range needs review every 30 days. The bot needs to be paused around major events. The strategy needs you to be paying attention, even if only 5 minutes a week.
It’s not a substitute for cold storage. Anything on the exchange is at exchange risk. My long-term BTC stack lives on a Ledger Nano X, not on the bot.
What if you only have $200 to deploy?
A lot of readers ask me this. Honest answer: don’t.
A 50-grid bot on a $200 allocation means each rung trades roughly $4. BitGet’s minimum order size on BTC/USDT is around 0.0001 BTC. At current prices, that’s roughly $6–$8. So your bot will struggle to place orders at all on the lower rungs.
Practical minimum for this strategy is around $500. Comfortable minimum is $1,000. Below that, you’re better off DCA’ing a fixed weekly amount into spot BTC and waiting.
If you want to use $200 to learn how the bot works without expecting returns, fine — deploy it with 20 grids on a wider range and treat it as tuition. Just don’t expect returns at that size.
Frequently asked questions
How much does the BTC/USDT spot grid bot cost to run?
The bot itself is free on BitGet. The only costs are trading fees (0.10% maker/taker on spot, reduced if you hold BGB) and any profit share if you’re copying a published bot.
What’s the minimum BTC I need to start?
There’s no fixed BTC minimum. The bot starts with USDT and BTC at the ratio you set. Practical minimum is around $500 equivalent total, with $1,000+ being a more comfortable starting point.
Can the bot lose money?
Yes. In strong downtrends the bot accumulates BTC as price falls. The unrealised loss on inventory can exceed the realised profit from completed round trips. Worst case, you hold BTC at an average above current market until price recovers.
Why BTC/USDT and not BTC/USDC?
Either works. BTC/USDT has higher liquidity on BitGet so I default to it. BTC/USDC pairs are also available with similar mechanics — just check the spot trading volume before deploying.
How often should I review the bot?
Weekly. Five minutes to glance at performance, current price vs range, any unusual events. Full review and potential range adjustment monthly.
What happens if BTC moons?
The bot sells off BTC inventory as price rises through the rungs. Once price exits the top of your range, the bot stops trading and sits in pure USDT. You miss the rest of the rally. The realised profit is locked in but the opportunity cost is real.
Is the published bot safer than running my own?
Same strategy, same risk. The copy-trade version takes a profit share but removes the setup work and the rebalancing decisions. The manual deploy is free but you handle the maintenance yourself.
Can I run this on the BitGet mobile app?
Yes. The grid bot interface is in the BitGet app under Trading Bots. Same functionality as the web version, slightly different layout.
My honest summary
This bot is the boring, profitable, slightly tax-annoying piece of my portfolio. It doesn’t make headlines. It doesn’t ten-x in a quarter. It quietly compounds 1–2% per month most of the time and breaks even when it can’t.
I run it because BitGet’s native bot is free, BTC/USDT is the safest pair to deploy against, and the strategy works in the market condition BTC spends most of its time in. The maths is simple. The risks are real but bounded. The returns are predictable enough to plan around.
If you want the same setup on your account, the published version is one click. The manual settings are above if you’d rather build it yourself. Either way, open a BitGet account (affiliate) and the bot is live in 5 minutes.
If you want the broader framework for grid bots before deploying, the BitGet spot grid bot guide walks through the mechanics. If you want to know how to buy your initial BTC on BitGet, the how to buy Bitcoin post has the step-by-step.
Right — over to you.
Same bot. One click.
My BTC/USDT spot grid is published on BitGet. Copy the settings, deploy in under 5 minutes, monitor weekly.
Affiliate link.
Related posts
- BitGet Spot Grid Bot: Setup, Settings, Strategy
- Crypto Trading Bots: What Actually Works
- BitGet Spot Trading Guide