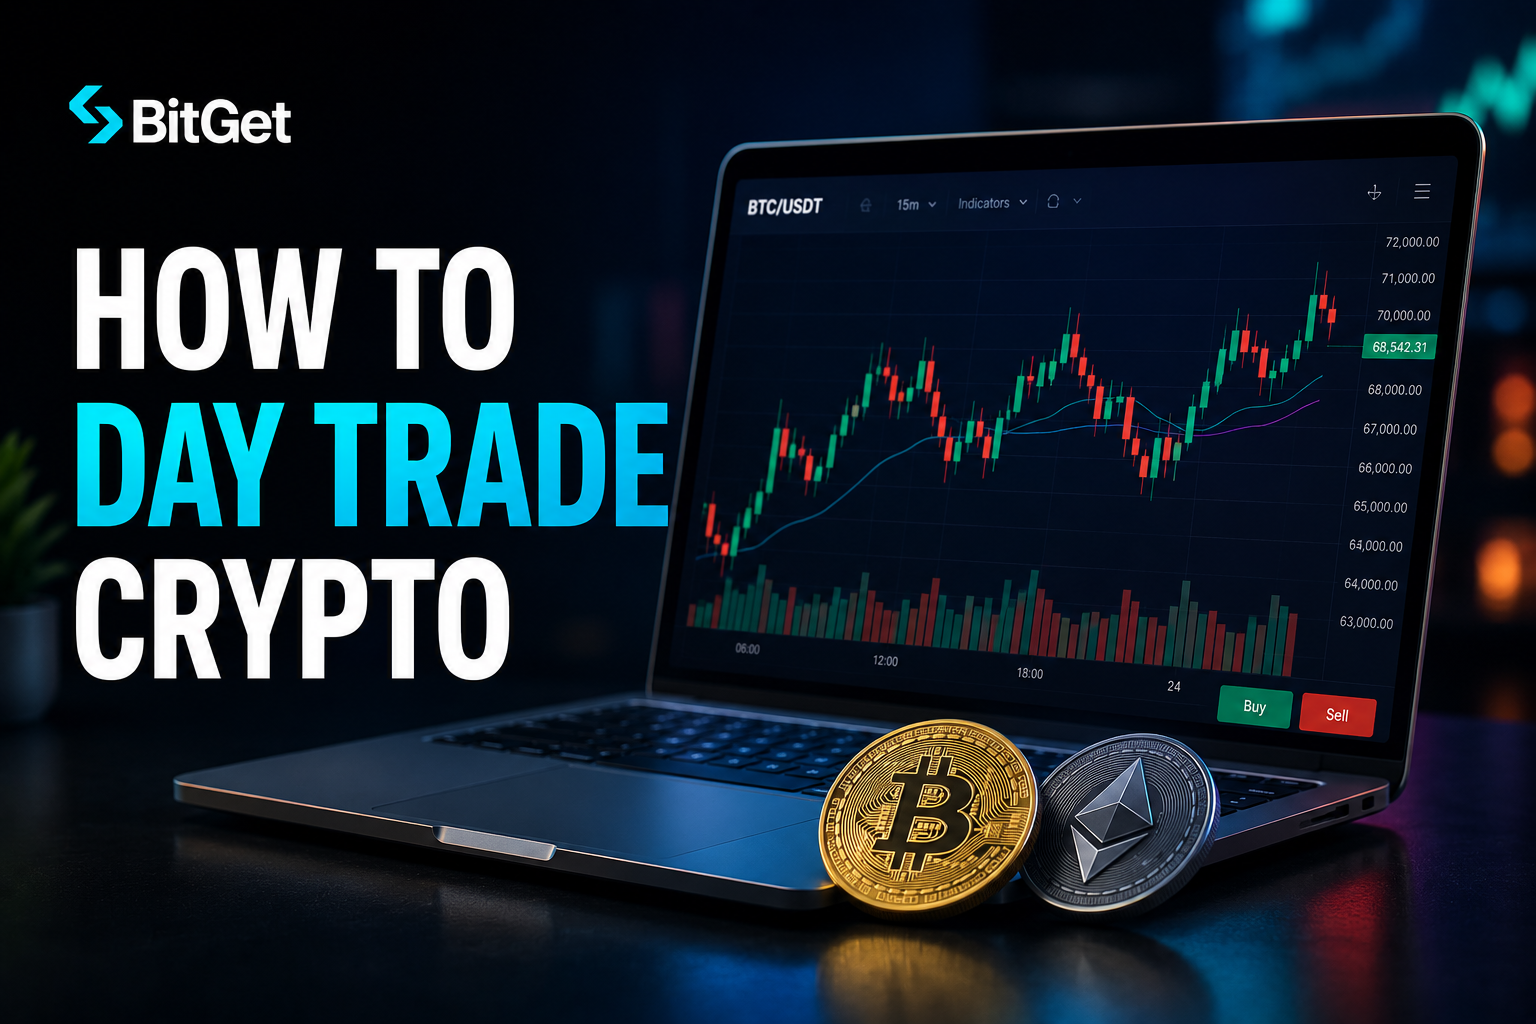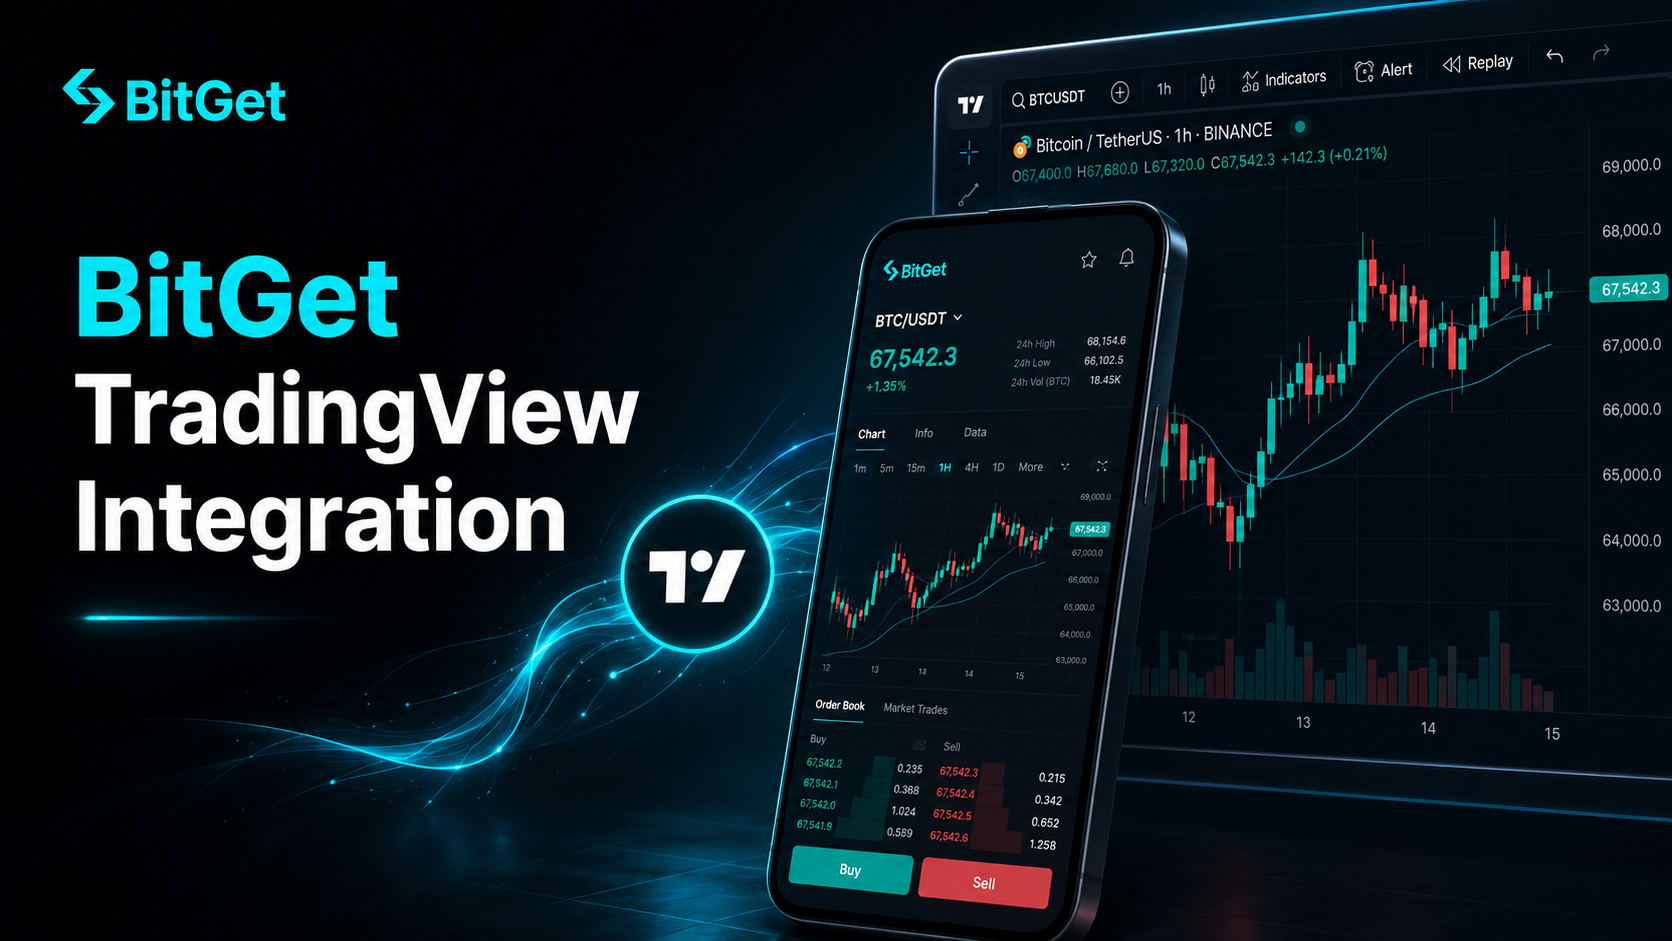
The first time I opened the BitGet chart panel I thought it was a stripped-down skin. It is not. It is a full TradingView build wired into the order pad, and most traders never push it past the default 15-minute candle. That is leaving money on the table.
This post is the setup I actually use as a swing trader on BitGet — the indicators, the drawing tools that matter, the alert system, and the template I save to every chart so I am not redrawing trend lines at 6am.
Short answer: BitGet ships a fully integrated TradingView chart on every spot and futures pair. You get the standard library of 100+ indicators, drawing tools, multi-timeframe view, and BitGet-side alerts that trigger directly into your account. The integration is free, no TradingView subscription required for the in-platform chart, and the only paid features missing are server-side alerts on TradingView’s own platform. My take: it is the second-best free chart on any exchange after Binance, and arguably better for futures because the order panel sits beside it.
Open BitGet and try the charts → (affiliate link)
Key takeaways
- BitGet uses the official TradingView charting library — 100+ built-in indicators, every drawing tool, every timeframe from 1s to 1M.
- Alerts set inside BitGet trigger in your BitGet notification feed, not in TradingView’s own alert system.
- Multi-chart layouts are not supported in the in-platform view — for that you still need a paid TradingView account.
- Chart templates save indicator stacks, drawing styles, and timeframes for instant recall.
- The mobile chart has feature parity for the core tools but smaller drawing precision.
What BitGet’s TradingView integration includes
BitGet licenses the official TradingView Charting Library and embeds it directly into the spot and futures trading pages. That is not a copy — it is the same engine you see on tradingview.com, with most of the toolset enabled.
You get:
- 100+ built-in indicators — every moving average, oscillator, volume tool, and trend system in the standard TradingView library.
- All standard drawing tools — trend lines, channels, Fibonacci retracements and extensions, pitchforks, Gann tools, text and notes.
- Every timeframe — 1 second, 1 minute, 5m, 15m, 1h, 4h, 1D, 1W, 1M, plus custom intervals.
- Bar replay — scrub back through historical candles to test how a setup would have played out.
- Saved chart templates — store an indicator stack and call it back in two clicks.
- Multi-timeframe panes — view the same pair on three timeframes side by side.
- Alerts — price, indicator-based, drawing-based.
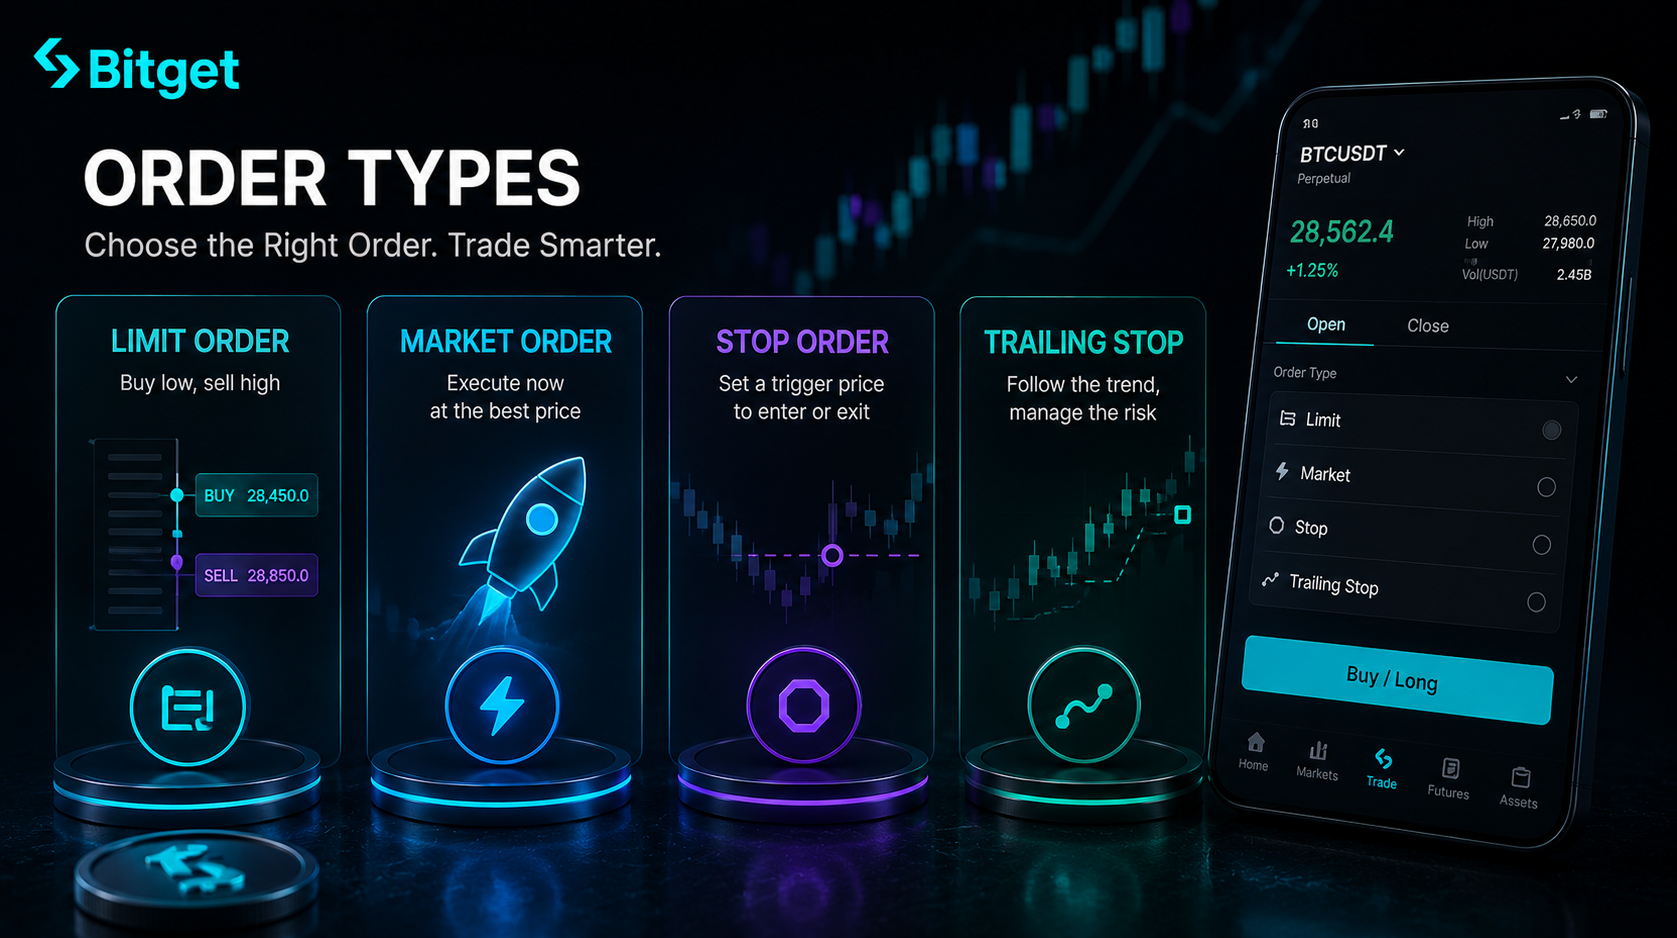
- Order pad integration — place a limit, market, or stop order without leaving the chart.
The order pad piece is the one most people underrate. On standalone TradingView you draw a level, decide it is the entry, then tab over to your exchange to place the order. On BitGet the order pad sits beside the chart. Right-click a trend line, hit “Buy at this price”, set the quantity, done.
What is missing vs the paid TradingView
If you have a TradingView Pro subscription ($14.95/month at time of writing) you get a few things the BitGet integration does not:
- Multi-chart layouts on a single screen — Pro supports 2 charts, Pro+ 4, Premium 8. BitGet shows one chart at a time.
- Server-side alerts — TradingView alerts fire even if your browser is closed because they run on their servers. BitGet alerts are tied to your BitGet session.
- Custom Pine Script indicators — the BitGet build does not let you load community Pine scripts. Built-in indicators only.
- More indicator slots — TradingView Pro lets you stack more indicators on a single chart than the BitGet build allows.
For 90% of my chart work, the BitGet integration is enough. If you are running Pine scripts or watching 8 pairs at once, keep your TradingView subscription open in a second tab.
How it differs from the standalone TradingView
Three differences worth understanding before you commit to either workflow.
Data source
The BitGet chart pulls its candle data straight from BitGet’s own order book. Standalone TradingView lets you select the exchange — BITGET, BINANCE, BYBIT, COINBASE, KRAKEN — and you can flip between them. If you want to spot a divergence between BitGet’s price and the wider market, standalone TradingView wins. If you want to trade on BitGet’s exact tape, the integrated chart is what you want.
Order routing
Standalone TradingView has a “Trading Panel” that connects to brokers and a few exchanges. BitGet is supported via the integration but the experience is one extra step compared to placing the trade directly in the BitGet UI. For day trading on BitGet, the integrated chart is faster.
Alert delivery
Set an alert on standalone TradingView — it can fire via email, SMS (paid tiers), webhook, or in-app push. Set an alert on the BitGet chart — it fires in the BitGet notification feed and as a push notification on the mobile app. Different systems. Different reliability.
I use both. TradingView for the watchlist of 30 coins I scan daily. BitGet for the 2-4 pairs I am actively trading that week.
Setting up your first chart (step-by-step)
If you have never customised a chart on BitGet, here is the 10-minute setup.
- Open any spot or futures pair. Click the asset in the markets list to load the trading view.
- Click the chart settings (gear icon, top right of the chart). You will see panes for “Symbol”, “Scales”, “Appearance”, “Trading”, “Events”.
- Set the appearance. I run a dark background, green candle bodies up, red candle bodies down, hollow up candles (so I can see the wick body separation). Cosmetic but it cuts eye strain on a 3-hour session.
- Switch chart type. Top toolbar has the chart type dropdown — candles, Heikin Ashi, line, area, Renko, bars. I run standard candles 95% of the time and Heikin Ashi for trend confirmation only.
- Add your first indicator. Click the “fx” indicator icon top-left. Search “EMA”. Add EMA(20), EMA(50), EMA(200) on the daily. That is the trend filter.
- Add a second pane. RSI(14) goes in a sub-pane below the price. Click “fx” again, search RSI, add. Settings: 14 period, levels 30 and 70.
- Save as template. Top toolbar, “Save” icon, name it “Trend + RSI base”. You can now load this on any pair with one click.
That is the foundation. Everything beyond this is taste.
Indicators I use (and why)
Six indicators do 95% of my chart reading. The other 90 in the library mostly repeat what these say in different colours.
EMA stack (20, 50, 200)
The trend filter. If the 20 is above the 50 and the 50 is above the 200, the trend is up — I look for longs. If the order is reversed, I look for shorts. Crossings of the 20 and 50 mark trend shifts on the daily.
RSI(14)
The overextension check. Above 70 means the rally is stretched. Below 30 means the sell-off is stretched. I do not buy bottoms or sell tops on RSI alone — I use it to filter out trades that are entering into an obviously extended move.
Volume
Volume on every chart. A breakout on falling volume is usually a fakeout. A breakdown on rising volume usually keeps going. The basic BitGet spot trading guide covers how to read volume context on different pairs.
VWAP
Volume Weighted Average Price. On intraday timeframes this acts as a magnet — price tends to revert to it. I use it as a mean-reversion entry when I am scalping during a slow session.
Bollinger Bands (20, 2)
Volatility envelope. When the bands squeeze tight, a breakout is coming. Direction is not predicted by the bands — only the timing.
Pivot Points (standard)
Daily pivot, R1, R2, S1, S2. Free levels that everyone watching the chart can see, which is what makes them reactive zones. I draw nothing else on intraday futures charts — pivots are usually enough.
What I don’t use
MACD. Stochastic. Ichimoku. Williams %R. These work for some traders. For me they overlap with the EMA stack and RSI without adding signal. Less is more on a chart you actually have to read at speed.
Drawing tools that matter (and ones to skip)
The drawing toolbar has 50+ tools. Most are noise. These four do the heavy lifting.
Horizontal lines
The most useful drawing tool ever invented. Mark prior highs, prior lows, round numbers, prior swing pivots. Price respects horizontal levels because everyone else is watching them.
Trend lines
Two-point trend lines connecting higher lows in an uptrend or lower highs in a downtrend. A break with volume is a signal. A break without volume is a fake.
Fibonacci retracement
Anchor it to the most recent swing high and swing low. The 0.5 and 0.618 levels are the highest-probability pullback zones in a trend. I do not use the extension tool — extensions overpromise targets and I prefer to manage exits with structure.
Rectangles / zones
Mark a supply or demand zone as a box, not a line. Price reacts to zones, not pixels. I draw a 0.5-1% zone around every prior swing high or low and treat the zone as the level.
Skip these
Gann tools, pitchforks, Andrews’ pitchfork, regression channels, parallel channels with multiple touch points. They look impressive on a screenshot. They predict nothing more reliably than a horizontal line and a trend line, which take 5 seconds to draw.
The shortcut here: pin the four tools above to your favourites bar (right-click each tool, “Add to favorites”). Now they are one click away on every chart.
If you want to actually learn to read these tools rather than read about them, the Trade Travel Chill (affiliate link) community is the structured course I came up through — it is the one trading education source I send people to when they ask. Chart reading is a skill that compounds, and you do not learn it by reading blog posts. You learn it by drawing 1,000 trend lines and getting feedback.
TradingView alerts vs BitGet alerts
The alert system is where the two platforms diverge most.
BitGet alerts
Set them by right-clicking on the chart at the price you want to be notified about. They appear as a horizontal line with an alarm icon. When price hits, you get:
- A push notification on the BitGet mobile app
- A notification in the BitGet web UI notification feed
- An email if you have email alerts enabled in account settings
Reliability: high, as long as your BitGet account is logged in somewhere. If you log out completely on every device, the push pipeline can stop.
Standalone TradingView alerts
Set on tradingview.com via the alert dialogue. Triggers can be:
- Price crossing a level
- Indicator value crossing a threshold (RSI > 70, MACD crossover, etc.)
- A drawing tool being crossed
- A custom Pine Script condition
Delivery: in-app, email, SMS (paid), or webhook. Webhooks are the killer feature — you can route an alert to Discord, Telegram, a custom bot, or even directly into a trading system. Free tier: 1 active alert. Pro: 20. Pro+: 100.
My setup
Active trade entries and stops: BitGet alerts. They route to the right place and I am usually in the BitGet UI when they fire anyway.
Watchlist scanning across 20+ coins: TradingView alerts. The free tier limit means I cycle alerts as setups develop.
Bot triggers and automation: TradingView alerts with webhooks pointing at a private endpoint. If you ever want to automate a discretionary strategy, this is the path.
Multi-timeframe analysis
The discipline that separates traders who survive from traders who do not: every entry should agree on at least two timeframes.
My standard pre-trade check on a 4h swing:
- Daily trend. Open daily chart. Where is price relative to the EMA stack? Above all three EMAs = trend up. Trade longs.
- 4-hour structure. Open 4h. Higher highs and higher lows = uptrend confirmation. Lower highs and lower lows = trend down.
- 1-hour entry. Open 1h. Look for a pullback to a prior swing or the 0.5-0.618 fib. Wait for a candle close confirmation.
That is the multi-timeframe rule. Three charts, three answers. If any of them disagrees, I skip.
The BitGet integration does not show three charts side by side — for that you would need TradingView Pro or you switch timeframes manually. The faster workaround on BitGet is to open the same pair in three browser tabs, each set to a different timeframe. Clunky but it works.
For futures specifically, the BitGet futures USDT-M guide goes deeper on timeframe selection for perpetual trading.
Saving and reusing chart templates
This is the feature most beginners ignore and most pros use constantly.
A chart template stores: every indicator on the chart, all settings (period, colour, line thickness), the colour theme, the timeframe, the drawing styles. It does not store specific drawings — those are saved per chart symbol.
I run three templates:
- “Swing daily” — daily timeframe, EMA(20/50/200), RSI(14), volume. For overnight position sizing.
- “Scalp 5m” — 5-minute timeframe, VWAP, Bollinger Bands, RSI(14), volume. For intraday futures.
- “Clean” — no indicators, just candles and volume. For when I want to read price action without bias.
Loading a template is one click. New pair, new analysis, new mood — load the template, the chart matches what I need.
To save: top toolbar, the “Save” icon, “Save chart layout”. Name it. Done.
To load: same icon, “Load chart layout”, pick from your list.
If you trade across multiple pairs every week, build these three templates before you place another trade.
Mobile vs desktop charting
The BitGet mobile app embeds the same TradingView build with a touch-friendly toolbar. What works and what does not:
What works on mobile
- Switching timeframes with one tap
- Adding common indicators (EMA, RSI, MACD, Bollinger)
- Drawing trend lines and horizontal lines with reasonable precision
- Loading saved chart templates
- Setting price alerts
- Placing market and limit orders from a long-press on the chart
What does not work as well
- Fibonacci retracement — touch precision is too low for accurate anchoring
- Multi-pane analysis — small screen, only one pane practical
- Custom indicator configuration with many parameters
- Reading a 1-minute chart in detail — pixels are too small
My rule: I monitor on mobile, I draw on desktop. When I am at a coffee shop and want to check whether my swing trade is still on track, the mobile app is enough. When I am setting up a new position with proper levels and zones, I do it on the laptop.
If you trade from public WiFi a lot — coffee shops, hotels, co-working spaces — running a VPN on the device matters. I use NordVPN (affiliate link) on every device I trade from. It is a small monthly cost against the risk of an account takeover on a compromised network.
The setup I use as a swing trader
Putting it together, here is what a typical swing trade workflow looks like for me on BitGet.
Sunday evening review. Open BitGet on the laptop. Daily template loaded. Scan my watchlist of 25 coins by flicking through them in the markets panel. Looking for: trend confluence (EMA stack ordered), an oversold or overbought RSI condition, and a clean support/resistance level within 3% of current price.
Monday morning entry plan. For each setup, draw the level. Set a BitGet alert at the entry. Note position size and stop in a trading journal (I use a simple Notion page).
During the week. When an alert fires, I switch to the 4h chart and the 1h chart in two browser tabs. If structure still agrees, I take the trade. If not, I skip and reset the alert.
Exit management. I scale out at logical structure — prior highs, fib extensions of the swing, round numbers. Stop loss moves to break-even once the trade is up 1R.
Weekly review. Friday close, every closed trade gets a screenshot saved with the entry and exit marked. Mistakes get noted. Wins get the same treatment — was I right for the right reason, or did I get lucky?
This is not a strategy I can teach in a blog post. The chart reading underneath it took years to build. The structured way I came up was a paid community with weekly review sessions where someone better than me critiqued my charts. Trade Travel Chill is where that happens now — there is a TTC review on the site if you want my honest take.
If you want a wider look at where chart-reading fits among everything else a beginner needs to learn, crypto for beginners is the parent post.
Want to use the charts yourself?
BitGet’s TradingView integration is free on every account. Sign-up takes 90 seconds.
Affiliate link. I may earn a commission at no extra cost to you.
Quick reference: my BitGet chart hotkeys
The keyboard shortcuts that save the most time once you commit them to muscle memory.
| Action | Shortcut |
|---|---|
| Alt + T | Trend line |
| Alt + H | Horizontal line |
| Alt + V | Vertical line |
| Alt + F | Fibonacci retracement |
| Ctrl + Z | Undo last drawing |
| Ctrl + S | Save chart layout |
| Plus / minus | Zoom in / out |
| Left / right arrow | Scroll candles |
| F | Toggle fullscreen chart |
These work on the web version of BitGet. Mobile has no equivalent — every action is a tap.
Common questions about the BitGet TradingView build
Is the BitGet TradingView integration free?
Yes. Every BitGet account gets the integrated chart at no cost. There is no premium tier inside BitGet that unlocks more chart features.
Can I use my TradingView Pro account on BitGet?
The BitGet chart does not log in to your TradingView account. You get the same charting engine but indicators are limited to the standard library, no Pine Script imports. If you want your full TradingView setup, use tradingview.com in a separate tab.
Does BitGet support TradingView webhooks?
Not directly. If you want to automate trades from TradingView alerts, you need a third-party bridge (Cornix, AlertaTron, custom code via the BitGet API). The BitGet API trading post covers the API setup.
Why are my drawings disappearing?
Drawings are saved per pair, per device. If you draw on BTC/USDT spot on desktop and then open BTC/USDT futures on mobile, the drawings will not transfer — they are different symbols. Use chart templates to carry indicator stacks across pairs, but accept that drawings stay local.
Can I use Heikin Ashi candles on BitGet?
Yes. Top toolbar, chart type dropdown, Heikin Ashi. Useful for spotting clean trend phases but the candles are not the real price — your stop placement and entry should still be based on standard candles.
FAQ
What is the BitGet TradingView integration?
It is a fully embedded TradingView Charting Library inside the BitGet trading interface. You get 100+ indicators, all standard drawing tools, every timeframe, chart templates, and alerts — all for free, no TradingView account required.
Is BitGet’s chart as good as TradingView Pro?
For single-chart analysis, yes. For multi-chart layouts, custom Pine Script indicators, server-side alerts, and webhook automation, paid TradingView is more capable. Most discretionary traders are well served by the BitGet integration.
Can I draw on the BitGet mobile chart?
Yes, but touch precision limits which tools work well. Trend lines and horizontal lines are fine. Fibonacci retracements and pitchforks are difficult to anchor accurately on a phone screen.
Do BitGet chart alerts work when my browser is closed?
If the BitGet mobile app is installed and you are logged in, push alerts will fire. If you have only used the web version and closed your browser, alerts may not deliver. The mobile app is the reliable delivery path.
Can I export my chart drawings?
Not directly. BitGet does not have an export function for drawings. You can save chart templates (indicators, settings) but specific drawings stay on the chart. Screenshot is the standard workaround.
Does BitGet support 1-second candles?
Yes, on most major pairs. Sub-minute timeframes are noisy for swing trading but useful for scalping entries and exits.
What is the smallest chart timeframe on BitGet?
1 second on liquid pairs. 1 minute on less liquid pairs. The chart will tell you if the lower timeframe is unavailable for a given symbol.
Final word
The BitGet chart is a TradingView build, not a knockoff. Most of what you would use a paid charting tool for, you can do here for free. The gaps — multi-chart layouts, Pine Script, server-side alerts — matter only if you are running an active multi-coin watchlist or automating signals.
For 90% of the trading I do, the integration is enough. Get the EMAs and RSI on, save a template, learn the four drawing tools that matter, and use the alerts. That is the setup.
Right — over to you.
Ready to chart?
Open a BitGet account and the TradingView charts come standard. KYC clears same-day for most users.
Affiliate link.
External references
- Official TradingView Charting Library docs
- BitGet help centre — TradingView charts
- TradingView’s free indicator catalogue
- CoinGecko BitGet exchange page — for cross-reference of pair listings
Related posts