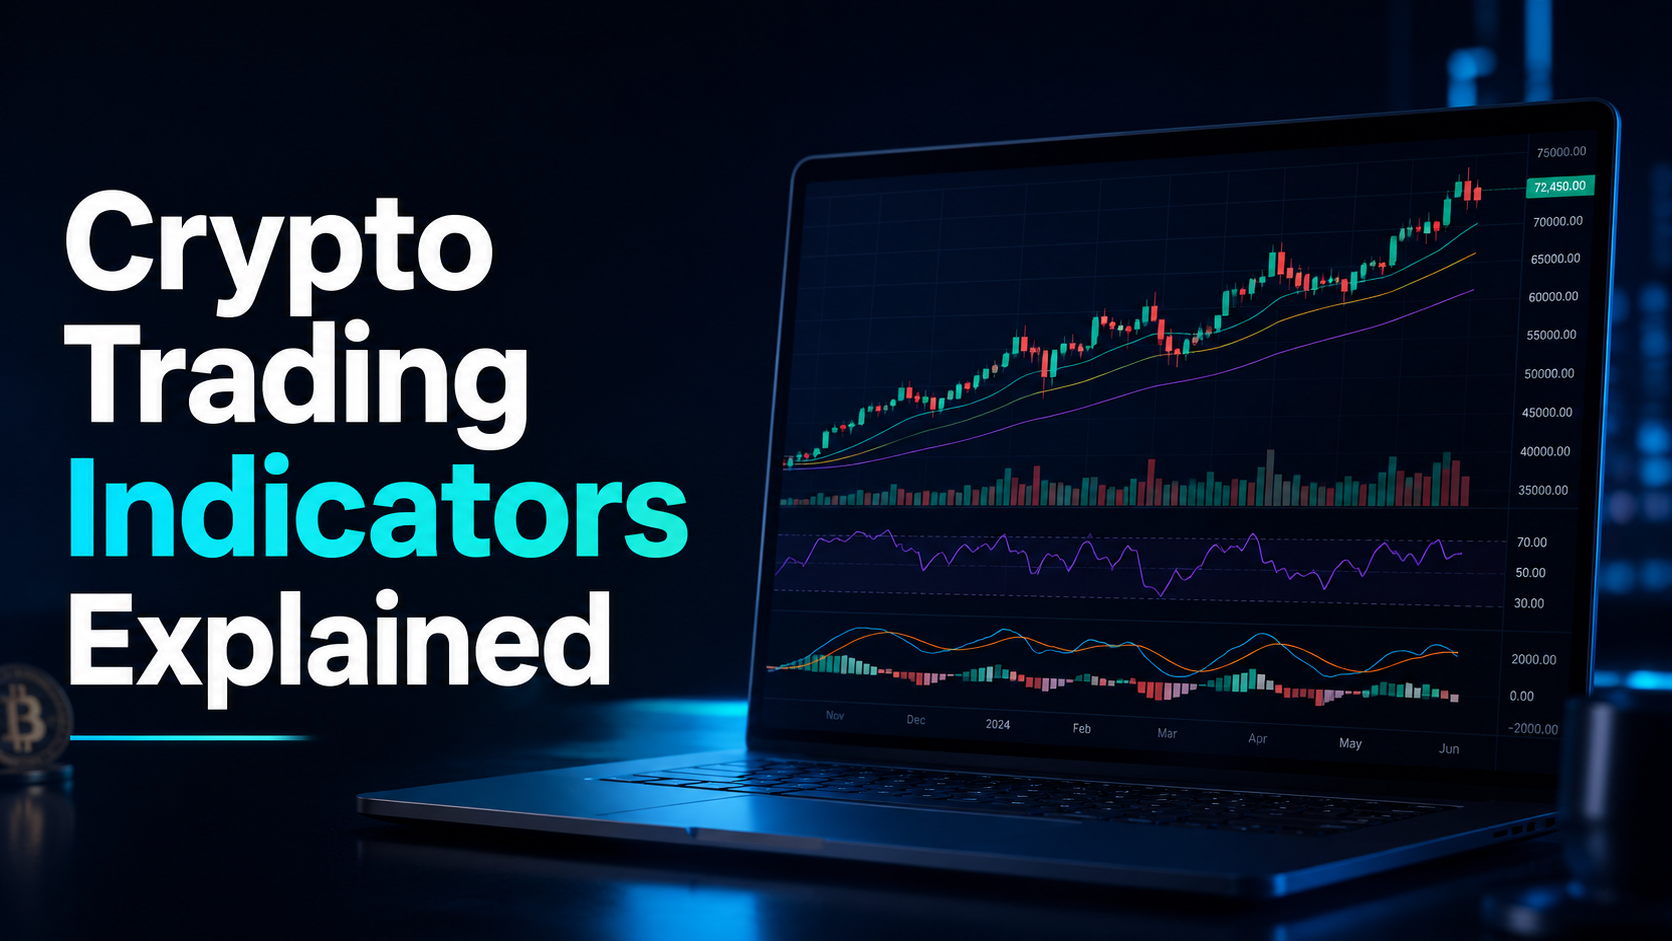
Open any beginner’s crypto chart and you’ll find six indicators stacked on top of each other, a rainbow of moving averages, and an oscillator panel below the price that takes up half the screen. None of that helps. The traders I know who actually make money use fewer indicators than the ones who don’t. The question isn’t which indicators are best — it’s how to use a small number of them well. Here’s the honest walkthrough of the ones that matter, the maths underneath, and the three-indicator combo I actually run.
Short answer: The crypto trading indicators worth learning are: RSI for momentum, MACD for trend changes, moving averages (20/50/200 EMA) for trend direction, Bollinger Bands for volatility, and volume profile / VWAP for institutional levels. Use 3 indicators max — one from each category (trend, momentum, volume) — not eight stacked on top of each other. Indicators are confirmation tools, not signal generators. The setup goes on TradingView; I execute on BitGet.
See Trade Travel Chill → (affiliate link) · Open BitGet → (referral)
Key takeaways
- Indicators are derived from price and volume — they don’t predict, they describe.
- Three indicators max. More creates conflicting signals and decision paralysis.
- RSI, MACD, and moving averages are the foundation. Everything else is supplementary.
- “Best indicator” is the wrong question. The right question is which combination fits your strategy.
- Most retail traders misuse indicators by treating signals as commands. They’re confirmation, not instructions.
Table of contents
- What indicators do (and don’t do)
- Why too many indicators is worse than too few
- RSI (Relative Strength Index) explained
- MACD explained
- Moving Averages (SMA vs EMA, the 20/50/200 setup)
- Bollinger Bands
- Volume Profile and VWAP
- Fibonacci retracement
- The “1 from each category” rule
- The 3-indicator combo I actually use
- How to add indicators on TradingView
- Common indicator misuse
- How I learnt to use them properly
- FAQ
What indicators do (and don’t do)
A technical indicator is a mathematical calculation applied to price and/or volume that visualises an aspect of market behaviour. RSI measures momentum. MACD measures the relationship between two moving averages. Bollinger Bands measure volatility.
Crucially: indicators are derived from price. They don’t predict the future — they describe what price has already done in a way that’s easier to read than the raw chart.
This sounds obvious but it changes how you should use them.
What indicators are good for
- Confirming signals you already see on the price chart (a hammer at support is stronger if RSI is oversold).
- Identifying regime (trending vs ranging) so you can pick the right strategy.
- Triggering alerts when specific conditions are met.
- Building rules-based systems with clear entry/exit criteria.
What indicators are bad at
- Predicting reversals on their own. “RSI is oversold so price will bounce” is unreliable. Price can stay oversold for weeks.
- Working across all market conditions. Mean-reversion indicators fail in trends. Trend indicators fail in ranges.
- Replacing chart reading. An indicator can’t tell you where major support is. You have to read that off the price.
The mental model that works: the chart is the dataset. The indicator is one lens to look at it through. Stacking lenses doesn’t show you more — it just blurs everything.
Why too many indicators is worse than too few
Most beginners come to charts thinking that more indicators = more information = better decisions. The opposite is true.
The conflict problem
Run RSI, MACD, Stochastic, Williams %R, CCI, and Money Flow Index simultaneously and at any given moment, at least two of them will give conflicting signals. You’ll have a reason to be long and a reason to be short. So you either take both (bad), neither (also bad), or rationalise picking the one that matches your existing bias.
The decision paralysis problem
When you have eight signals, you can’t act. You wait for “all signals to align” — which happens roughly never. You miss every trade because you’re waiting for perfect confirmation.
The “what’s actually working” problem
If you have one win and you were running six indicators, you don’t know which one helped. You can’t refine your edge because you can’t isolate the variables.
The fix
Three indicators. Maximum. Each from a different category:
- One trend indicator (moving averages, MACD)
- One momentum indicator (RSI, Stochastic)
- One volume or volatility indicator (Volume Profile, Bollinger Bands, VWAP)
I’ll explain each below.
RSI (Relative Strength Index) explained
RSI is one of the most popular momentum indicators. It oscillates between 0 and 100 and measures the speed and magnitude of recent price changes.
The maths (briefly)
RSI compares the average gain over the last N periods to the average loss over the same period. Default setting: 14 periods.
You don’t need to memorise the formula. What you need to know is how to read it.
The scale
- 0–30 = oversold. Price has fallen quickly. Possible reversal up.
- 30–50 = bearish neutral.
- 50–70 = bullish neutral.
- 70–100 = overbought. Price has risen quickly. Possible reversal down.
How to use it properly
The naive interpretation — “oversold = buy, overbought = sell” — gets people killed. In a strong downtrend, RSI can stay below 30 for weeks while price keeps falling. Buying every “oversold” reading is a way to bleed an account.
The better uses:
- Divergence. Price makes a new high but RSI makes a lower high. That’s bearish divergence — momentum is weakening even as price extends. Divergence at major levels is a strong signal.
- Failure to reach extremes. In a healthy uptrend, RSI hits 70+ regularly. When it can’t get above 60 anymore, the trend is weakening.
- Confluence with price action. RSI oversold + price at major support + bullish reversal candle = high-probability setup. RSI oversold alone = noise.
Investopedia’s RSI explainer covers the full mechanics if you want the deep version.
RSI on crypto specifically
Crypto markets trend hard. RSI overbought/oversold readings are less reliable than in equities because crypto can stay in extreme zones much longer. Use RSI for divergence and trend confirmation, not for naive overbought/oversold trading.
MACD explained
MACD = Moving Average Convergence Divergence. It measures the relationship between two exponential moving averages and is one of the best trend-change indicators around.
The components
- MACD line = 12-period EMA minus 26-period EMA
- Signal line = 9-period EMA of the MACD line
- Histogram = MACD line minus signal line (the bars below/above zero)
The default settings (12, 26, 9) work fine for crypto. Some traders adjust them — I haven’t found significant improvement from custom settings on majors.
How to read it
- MACD crosses above signal line = bullish momentum shift. Often used as a buy signal.
- MACD crosses below signal line = bearish momentum shift. Sell signal.
- MACD above zero = uptrend in force.
- MACD below zero = downtrend in force.
- Histogram expanding = momentum increasing.
- Histogram contracting = momentum slowing (often precedes reversals).
How to use it properly
MACD is a lagging indicator. By the time you get a crossover, the move is often well underway. This is fine if you’re catching a multi-day swing. It’s terrible if you’re trying to scalp.
The best MACD setups in my experience:
- MACD crossover at a key support level on the higher timeframe. Combines momentum shift with structural level.
- Histogram divergence at trend extremes. Like RSI divergence — price makes a new high, histogram makes a lower high. Momentum is fading.
- Zero-line crosses in trends. When MACD moves from below zero to above (or vice versa), the trend regime has shifted.
What to avoid: MACD as a standalone signal generator on lower timeframes. Too many false crossovers. Use it on the 4-hour or daily.
Moving Averages (SMA vs EMA, the 20/50/200 setup)
Moving averages are the most-used indicator across all markets, and for good reason — they’re simple and they describe the trend.
SMA vs EMA
- SMA (Simple Moving Average) — the average closing price over the last N periods.
- EMA (Exponential Moving Average) — same idea but weights recent prices more heavily.
EMA reacts faster to price changes. SMA is smoother. For crypto, I prefer EMA because crypto moves fast and lagging signals cost money.
The 20/50/200 setup
Three EMAs covering different timescales:
- 20 EMA — short-term trend. Acts as dynamic support/resistance in strong trends.
- 50 EMA — medium-term trend. Used by many traders as the “trend filter.”
- 200 EMA — long-term trend. The “macro” line. Price above = long-term bullish. Price below = long-term bearish.
When all three are stacked in order (20 > 50 > 200) and rising, you have a clean uptrend. The opposite for downtrends.
How to use them
- Trend identification. If 50 EMA is above 200 EMA and rising, the trend is up. Trade long, skip shorts.
- Dynamic support/resistance. Price often pulls back to the 20 or 50 EMA in trends and bounces. Good entry points.
- Crossovers. Golden cross (50 EMA crosses above 200 EMA) is a classic bullish signal. Death cross (the opposite) is bearish. Lagging but high-quality signals.
- The 200 EMA filter. Many of my best setups are: long-only when price is above 200 EMA, short-only when below. Stops most counter-trend trades dead.
The 20/50/200 setup is on every chart I look at. It’s the closest thing to a default that exists.
Bollinger Bands
Bollinger Bands are a volatility indicator. They’re two standard deviations above and below a 20-period moving average, creating a “band” that contains most price action.
How to read them
- Bands widening = volatility increasing.
- Bands contracting = volatility decreasing, often before a big move (the “squeeze”).
- Price touching upper band = overbought relative to recent volatility.
- Price touching lower band = oversold relative to recent volatility.
How to use them properly
The naive use — “buy at the lower band, sell at the upper band” — is mean reversion and fails in trends. In a strong uptrend, price can ride the upper band for weeks.
The better uses:
- Squeeze identification. When bands contract sharply, volatility is compressing. A breakout in either direction often follows. Don’t predict direction — trade the break.
- Trend strength via “band walking.” In strong trends, price stays glued to one band. Recognise this as a sign to stay in the trade, not as a signal to fade.
- Reversal confluence. Lower band touch + RSI oversold + key support level + reversal candle = high-probability long. Lower band touch alone = noise.
My take
I use Bollinger Bands occasionally for volatility regime, not as a primary indicator. They’re useful but they’re easy to misuse. If you only run three indicators total, Bollinger Bands is probably not one of them — unless you specifically trade volatility-based strategies.
Volume Profile and VWAP
Volume-based indicators get under-used by retail traders. They’re some of the most useful.
Volume Profile
Shows the amount of volume traded at each price level (rather than at each point in time). Plotted as a horizontal histogram on the right side of the chart.
The high-volume areas are levels where lots of trading occurred — they tend to act as support/resistance going forward because many positions were opened there. The “Point of Control” (POC) is the price with the highest volume — often a magnet for price action.
VWAP (Volume-Weighted Average Price)
The average price weighted by volume over a defined period (usually the trading day, week, or anchored to a specific event). Institutional traders use VWAP as a benchmark for execution quality.
For retail crypto:
- Price above VWAP = bullish for the period.
- Price below VWAP = bearish.
- Bounces off VWAP = often clean entries.
- VWAP slope = trend direction for the period.
Anchored VWAP (starting from a specific event like the cycle low or an ETF approval) often acts as long-term support or resistance.
How I use them
I add Volume Profile on the daily chart when I’m marking up swing trades — the high-volume nodes show me where the heaviest positioning is. VWAP I use mostly on intraday timeframes when day trading.
These aren’t beginner indicators — they take some practice to read. But they’re worth the effort because they show real institutional/positional information instead of just derived price math.
Fibonacci retracement
Fibonacci retracement levels mark percentage pullbacks within a larger move. The standard levels: 23.6%, 38.2%, 50%, 61.8%, 78.6%.
How to use them
Draw a Fib retracement from a major swing low to a major swing high (in an uptrend). The horizontal lines mark levels where price might pull back to before continuing.
- 0.382 and 0.618 are the most-watched levels for pullback entries.
- 0.5 is a halfway point — psychological more than mathematical.
- 0.786 is the deep pullback — last chance before the trend’s structure is in question.
My take
Fib is a tool, not a magic system. Fib levels work better as zones of confluence with other levels (horizontal support, moving averages) than as standalone targets. Don’t trade purely off a Fib touch. Wait for confirmation — a reaction candle, a volume spike, an RSI reading.
The trader subculture has elevated Fib to mystical status. It’s useful. It’s not magic.
Learn to use indicators without overusing them
Most indicator courses teach you to add more. TTC taught me to use fewer, better. Structured modules, real working traders, and a community that calls out indicator-overload mistakes in real time.
Affiliate link.
The “1 from each category” rule
The most useful framework for indicator selection.
There are three broad categories:
1. Trend indicators
Tell you what direction the market is going.
- Moving Averages (SMA, EMA)
- MACD
- ADX (Average Directional Index)
2. Momentum indicators
Tell you how fast price is moving and whether momentum is increasing or decreasing.
- RSI
- Stochastic
- Williams %R
- CCI
3. Volume / volatility indicators
Tell you whether the move is backed by participation or running on fumes.
- Volume bars
- Volume Profile
- VWAP
- Bollinger Bands
- ATR (Average True Range)
The rule
Pick one indicator from each category. Don’t pick two from the same category — they’ll give correlated information and you’ve just added clutter.
A trader using EMA + RSI + Volume has three lenses on the same chart, each showing different information. A trader using RSI + Stochastic + Williams %R has three indicators showing essentially the same thing — momentum — and will get confused when they disagree.
The 3-indicator combo I actually use
Here’s what’s on my chart 90% of the time.
1. 20/50/200 EMA
Trend. The three EMAs together show me the dominant trend across timescales. I use 20/50 as dynamic support/resistance for entries. I use 200 as the long-term filter — long-only above, short-only below in most cases.
2. RSI (14 period)
Momentum. Mainly for divergence at trend extremes. I don’t trade off RSI overbought/oversold directly. I do pay attention when price makes a new high but RSI makes a lower high — that bearish divergence has saved me from chasing late on a tonne of moves.
3. Volume bars
Participation. Always on. I look at the relationship between price candles and their volume bars — a strong move on weak volume is suspect. A breakout on volume spike is real.
That’s it. Three things. The combination gives me:
- Trend (EMAs)
- Momentum (RSI)
- Participation (Volume)
Everything else I might add — Fib retracement, Volume Profile, anchored VWAP — is situational, not default. When I’m marking up a swing trade I might add them. For day-to-day chart reading, I keep it simple.
Why this combo works
It’s the minimum viable set. Each indicator answers a different question. There’s no overlap, so signals don’t conflict — they either align or they disagree. When they align (e.g., uptrend on EMAs + RSI not yet overbought + volume confirming) I take the trade. When they disagree, I skip.
How to add indicators on TradingView
This is the practical bit.
- Open your chart on TradingView. Pick your asset (BTCUSDT on BITGET works for me).
- Click “Indicators” at the top of the chart.
- Search for the indicator name. RSI, MACD, Bollinger Bands — all built in.
- Click to add. It appears on the chart with default settings.
- Adjust settings if needed. Right-click the indicator name → Settings. Most defaults are fine.
- Save your layout. Right-click chart → “Save as default” so every new chart has your setup pre-loaded.
Pro tips
- Use a template. Save your full indicator setup as a template and apply it to any chart with one click.
- Colour code your indicators. Bullish-leaning signals one colour, bearish another. Helps quick visual reads.
- Hide overlays when not needed. Some indicators (Volume Profile, anchored VWAP) take up screen space. Add and remove as needed rather than leaving them on.
If you trade on BitGet, the BitGet TradingView integration lets you execute directly from the chart without switching apps. Worth setting up once.
The wider TradingView education hub has tutorials on every built-in indicator if you want to go deeper on any specific one.
Common indicator misuse
A list of mistakes I see repeatedly. Most of them I’ve made.
1. Trading purely off oscillator signals
“RSI is oversold, time to buy.” No. Oversold readings in trends keep going. Combine with price action.
2. Stacking redundant indicators
RSI + Stochastic + Williams %R + CCI — all momentum oscillators. Pick one.
3. Chasing optimised parameters
Spending hours tweaking RSI from 14 to 9 to 21 thinking you’ll find the magic number. The default settings work fine. The edge is in how you use the signal, not in the parameter.
4. Backtesting on visible chart
Drawing indicators on a past chart and seeing where they “would have signalled” is hindsight. Forward-test on live charts or you’ll fool yourself.
5. Ignoring context
A bullish MACD cross during a global market crash is not a buy signal. Indicators don’t know about news. You do.
6. Treating signals as commands
“MACD crossed up so I bought” — this is mechanical thinking that ignores price structure. Indicators are confirmation. The trade idea should already exist from price action.
7. Hiding behind indicators
Some traders add indicators to avoid making decisions. “I’ll wait for all five signals to align.” They never do. You stay paralyzed and miss every trade.
8. Wrong indicator for the regime
Mean-reversion indicators (RSI, Bollinger) in a trend = death. Trend-following indicators (MA crosses) in a range = chop. Match the indicator to the market.
How I learnt to use them properly
Three stages.
Stage 1: Information overload
I stacked every indicator I’d read about. RSI, MACD, Bollinger, Stoch, CCI, Williams %R, three sets of moving averages, ADX, ATR. My chart was unreadable. I rationalised every trade with whichever indicator happened to confirm what I already wanted to do.
Stage 2: Stripping back
I cut the indicators one at a time until I was left with the bare minimum that I actually used in decisions. Result: 20/50/200 EMA, RSI, Volume bars. The chart was clean. My signals were clearer. My win rate went up because I wasn’t taking conflicting-signal trades.
Stage 3: Community feedback
This was the step-change. Being in Trade Travel Chill (affiliate) meant I’d post a chart with my indicators and get feedback like “your RSI divergence read is right but the volume isn’t there to confirm — skip it.” That kind of real-time correction is what most retail traders never get.
The community taught me that indicators are a starting point for conversation about a setup, not a complete answer. Senior traders use indicators sparingly and with deep context. The TTC environment drilled that in faster than any course or YouTube playlist did.
If you want the full review of the community I’m in, see my Trade Travel Chill review. For comparison with other options, best crypto trading courses covers the alternatives.
Stop adding indicators. Start using fewer, better.
TTC is the community that taught me less is more. Real working traders, real walkthroughs, real risk management. The community I’m part of.
Affiliate link.
Frequently asked questions
What is the best indicator for crypto trading?
There’s no single best. The most-used combination is moving averages (for trend) + RSI (for momentum) + volume bars (for participation). The “best” indicator depends on your strategy and timeframe.
How do you read RSI for crypto?
RSI oscillates 0–100. Above 70 = overbought. Below 30 = oversold. In trending markets, these levels can persist for weeks. The most useful signal is divergence — price makes a new high while RSI makes a lower high (bearish) or vice versa.
What is the MACD indicator used for?
MACD measures momentum and trend changes. The most common signal is the MACD line crossing the signal line (bullish or bearish). Best used on higher timeframes (4-hour and daily) to avoid false signals on lower timeframes.
Which moving averages are best for crypto?
The 20, 50, and 200 EMA are the standard combination. The 20 EMA is short-term trend, 50 EMA is medium-term, 200 EMA is the long-term filter. EMA (exponential) reacts faster than SMA (simple) — better for fast-moving crypto.
How many indicators should I use on a crypto chart?
Three. One trend, one momentum, one volume or volatility. More than that creates conflicting signals and decision paralysis.
Are Bollinger Bands good for crypto?
Useful for volatility but easy to misuse. Naive “buy at lower band, sell at upper band” fails in trends. Better used to identify volatility squeezes that precede breakouts.
What’s VWAP and is it useful in crypto?
VWAP = Volume-Weighted Average Price. Institutional benchmark for execution. In crypto, it acts as dynamic support/resistance and trend direction. Anchored VWAPs from major events (cycle lows, ETF launches) often hold as long-term levels.
Can indicators predict crypto price movements?
No. Indicators describe what’s already happened. They don’t predict. They help confirm setups and identify regime, but they don’t tell the future.
Should I use the same indicators on all timeframes?
The indicators themselves work on any timeframe. Default settings (RSI 14, MACD 12/26/9) are fine across. But signals from higher timeframes are more reliable than the same signals from lower timeframes.
Where do I add indicators on BitGet?
BitGet’s built-in chart has the major indicators. For deeper customisation, use BitGet TradingView integration to get the full TradingView indicator library.
Final word
Indicators are tools. Tools don’t trade for you.
The work of trading is reading the chart, identifying setups, sizing positions, and managing risk. Indicators help with one slice of that — confirming what the chart is already showing. They don’t replace any of the harder work.
Three indicators, well-chosen, used as confirmation rather than commands. That’s the playbook. Adding a fourth and a fifth doesn’t make you smarter — it makes your signals fight each other.
If you want to learn to use indicators in the context of a complete trading process — not just as line drawings on a chart — Trade Travel Chill (affiliate) is where I learnt to integrate them properly. For execution, BitGet (referral) is the exchange I use, with the BitGet TradingView integration so I can run my full indicator setup and trade from the same screen.
Right — over to you.
Related posts
- Trade Travel Chill Review: Where I Actually Learned to Trade
- How to Read Crypto Charts: A Beginner’s Guide
- BitGet TradingView Integration — How to Use the Charts