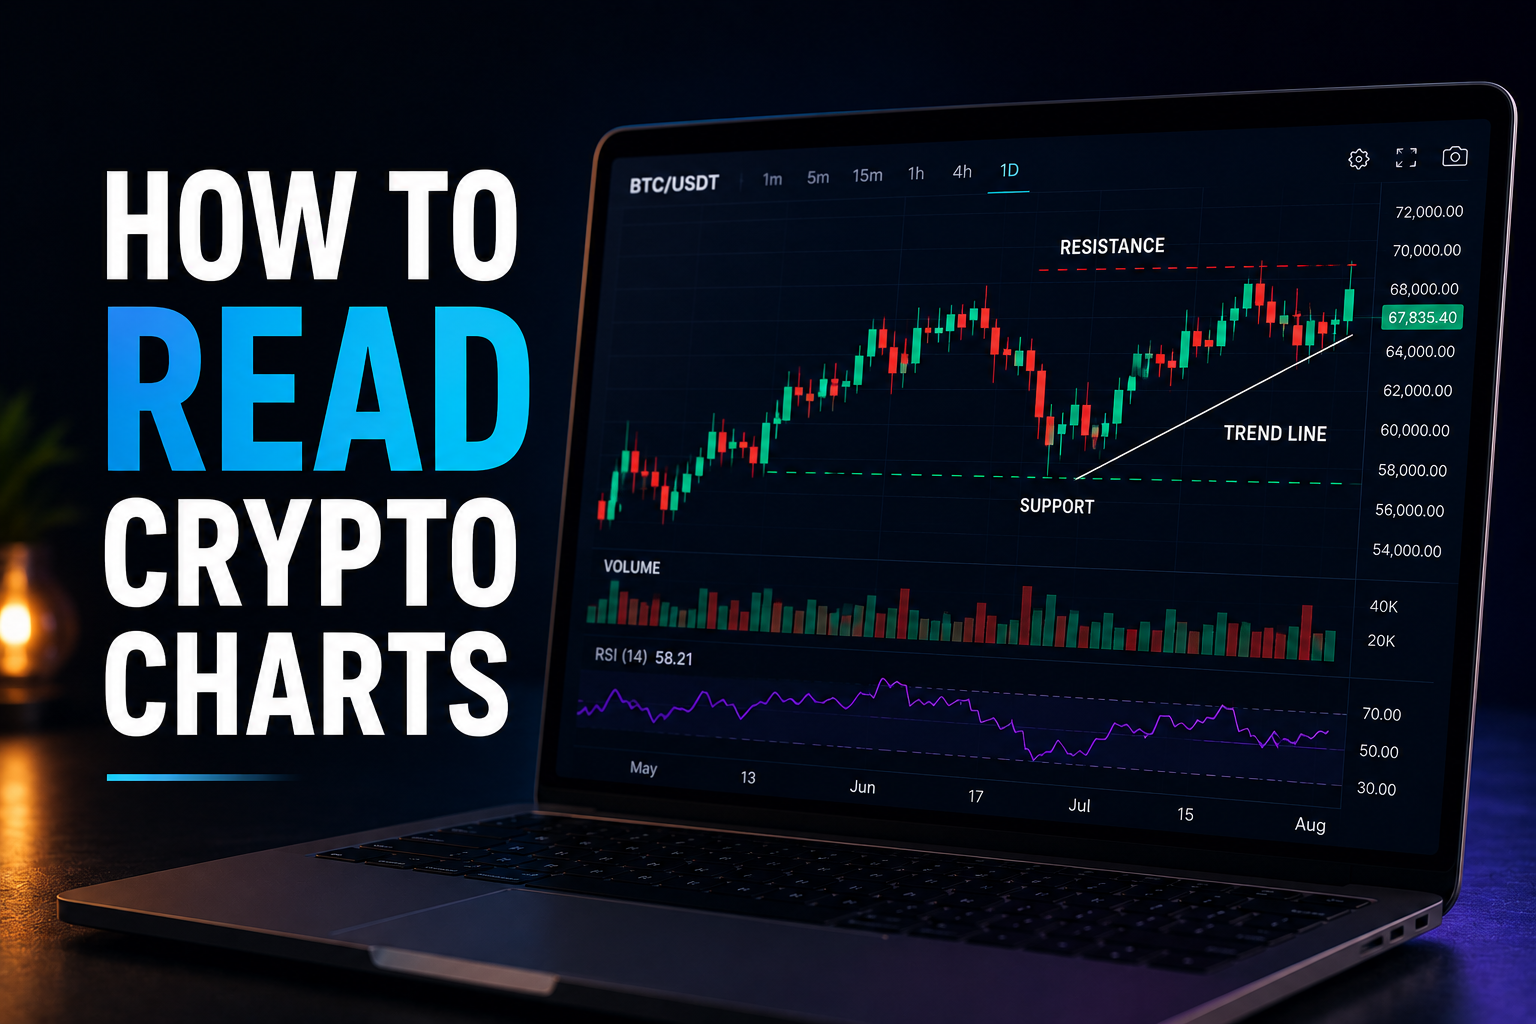
Bitcoin gaps up $400 in three minutes during a CPI print. Three candles burn vertical, then the chart calms down. Two days later, price drifts back into the middle of that vertical move, holds for an hour, then continues higher. That gap-and-fill is a Fair Value Gap doing exactly what the framework says it should do.
I ignored FVGs for two years because they sounded like astrology. Then I started marking them in hindsight on Bitcoin’s daily chart and found a pattern I couldn’t unsee — most of the time, price came back to fill them. Not always. Not on the same timeframe. But often enough that I had to take the concept seriously.
Short answer: A Fair Value Gap (FVG) is a three-candle pattern that shows up when price moves so fast in one direction that there’s an imbalance in the auction — buyers (or sellers) didn’t have a chance to participate at certain price levels. The gap is identified by the body of the middle candle: in a bullish FVG, the high of candle 1 sits below the low of candle 3, leaving an “untraded” zone on candle 2. The market tends to return to fill these gaps. Bullish FVGs become demand zones; bearish FVGs become supply zones. Combined with an order block at the same level, FVGs become one of the highest-probability setups in SMC.
See the structured course path that teaches this → (referral link)
Key takeaways
- A Fair Value Gap is a three-candle pattern where the high of candle 1 sits below the low of candle 3 (bullish) or the low of candle 1 sits above the high of candle 3 (bearish).
- The gap exists because price moved too fast for full participation — leaving an imbalance the market tends to revisit.
- Bullish FVGs are demand zones; bearish FVGs are supply zones. Price often returns to them on lower timeframes within hours; on daily timeframes, weeks or months.
- The strongest FVGs sit at the same level as order blocks. The FVG + order block combo is the highest-probability single setup in SMC.
- Not every FVG fills. The “failed FVG” pattern — when price walks away from a gap without filling — is itself a strong continuation signal in the direction of the original move.
Table of Contents
- What a Fair Value Gap (FVG) is
- The 3-candle pattern
- Why FVGs exist
- Why price tends to return to fill gaps
- Bullish FVG vs bearish FVG
- How to identify FVGs on different timeframes
- Premium vs discount FVGs
- Combining FVG + order block
- Combining FVG + liquidity sweep
- Entry rules using FVG
- Stop loss placement
- Take profit using the next FVG
- When FVGs DON’T get filled
- Where I learnt this
- FAQ
What a Fair Value Gap (FVG) is
A Fair Value Gap (sometimes called an imbalance) is a specific three-candle pattern that signals price moved through certain levels without full two-sided participation.
The clean academic definition: in efficient markets, every price level is supposed to receive both buyers and sellers — that’s how price “discovers” fair value. When price rockets through a range in a single candle, the levels inside that candle’s range didn’t get fair two-sided participation. Buyers may have lifted offers without sellers fully responding (in a bullish move), or sellers may have hit bids without buyers fully responding (bearish move).
The market’s auction theory holds that these imbalances tend to be revisited. Price comes back to where it skipped, looking for the participation that didn’t happen the first time. The gap is the “missing trade” that the market wants to complete.
In SMC framework terms, the FVG becomes a zone of interest — a level where price is statistically likely to react when revisited.
The acronym you’ll see most often is FVG. You’ll also see “imbalance” used interchangeably. Some traders draw a fine distinction between a true ICT-style FVG (specific candle pattern) and a wider imbalance concept (any price movement with insufficient two-sided participation), but practically you can treat them as the same idea.
For the wider context of where FVGs sit in the SMC framework, the smart money concepts crypto sibling post covers the full vocabulary.
The 3-candle pattern
The pattern is mechanical. Three consecutive candles. Specific relationship between candle 1 and candle 3.
Bullish FVG
- Candle 1 = any candle (often bullish but not required)
- Candle 2 = a strong bullish impulse candle
- Candle 3 = any candle whose LOW is above the HIGH of candle 1
The “gap” is the zone between the high of candle 1 and the low of candle 3. That entire price range exists only on the body of candle 2. Buyers blew through it in a single candle without sellers getting an opportunity to participate.
Bearish FVG
- Candle 1 = any candle
- Candle 2 = a strong bearish impulse candle
- Candle 3 = any candle whose HIGH is below the LOW of candle 1
The gap is the zone between the low of candle 1 and the high of candle 3. Sellers blew through it on candle 2 without buyers participating.
Marking the zone
Draw a rectangle:
– Top of zone (bullish FVG) = low of candle 3
– Bottom of zone (bullish FVG) = high of candle 1
– Extend the rectangle forward in time indefinitely until price returns to test it
For a bearish FVG, flip the references — top of zone is low of candle 1, bottom of zone is high of candle 3.
That’s the entire mechanical definition. Three candles. One geometric relationship. No interpretation.
Why FVGs exist (price moved too fast for full participation)
FVGs aren’t theoretical curiosities — they’re a side effect of how real markets work.
News-driven moves
Major news events compress hours of order flow into seconds. CPI prints, Fed decisions, halving countdowns, exchange exploits. Price moves before most participants can react. The candles that print during the news leg are usually FVG-creators.
Liquidity cascades
When stop losses cluster at a particular level (above a swing high or below a swing low), the moment one stop hits, it triggers the next, which triggers the next. Price cascades through the cluster in seconds. The cascade creates an imbalance on the chart — buyers (or sellers) couldn’t keep up with the velocity.
Session opens
In equities, market opens create gaps because order flow accumulates overnight and releases at open. Crypto trades 24/7, so it doesn’t have a true session open — but the start of the London or New York session often sees volatility spikes that produce FVGs on lower timeframes.
Liquidation events
Crypto’s high-leverage futures markets routinely produce cascading liquidations. When BTC drops 3% in a fast move, it’s often because long liquidations are cascading. The candle that handles the cascade is usually an FVG-creator.
Algorithmic execution
Market-making algorithms sometimes pull liquidity instantaneously when conditions change. The result: a thin order book gets blown through by even a moderately sized order. The candle shows the velocity of the move; the gap shows the missing participation.
In short: FVGs are evidence on the chart that the auction wasn’t complete. The market knows it. The market comes back to balance it.
A useful read on auction-market behaviour sits in Investopedia’s market-microstructure overview — it covers why participation matters and how it interacts with price discovery.
Why price tends to return to fill gaps
The mechanical pattern is the easy part. The “why does it work” is where SMC theory leans into auction theory.
The imbalance must be balanced
In academic auction theory, price exists to find equilibrium between buyers and sellers. When one side dominates so completely that the other side gets no participation, the price level is “unbalanced”. The market tends to revisit unbalanced levels to give the missing side a chance to participate. Once participation happens — usually as a small pullback in the opposite direction — the imbalance is considered “filled” and the original move can resume.
Liquidity resting in the gap
When buyers ran through a level without sellers participating, the order book at that level wasn’t fully cleared. Resting orders (limit orders that didn’t get matched) may still sit at those prices. When price returns, those resting orders get hit, providing the participation that was missing the first time.
Institutional re-entry
Some SMC traders frame FVG fills as institutional players using the imbalance as a re-entry zone for additional positioning. The original impulse was their initial fill; the fill of the FVG is where they add to the position before the next leg.
You don’t have to subscribe to any single explanation. The pattern is observable. Price fills FVGs at high frequency. Whether you call it auction theory, institutional positioning, or just statistical mean reversion, it works often enough to be tradeable.
How often do FVGs actually fill?
Hard data is scarce — most “studies” are informal observations on a specific dataset. But the rough consensus in the SMC community, supported by chart-based analysis, is:
- Around 70-80% of FVGs on the daily and 4-hour Bitcoin chart get filled within 30 trading sessions
- On 1-hour and 15-minute, fills tend to happen within hours or days
- On 1-minute and 5-minute, fills happen within minutes to a few hours
- Unfilled FVGs become continuation signals — see the failed-FVG section below
Babypips’ chart pattern education library covers the foundational candle behaviour that the FVG concept builds on top of.
Bullish FVG vs bearish FVG
Bullish FVG
Forms during an upward impulse. Becomes a demand zone — a level where price is expected to find buyer support when revisited. Traders use bullish FVGs as long entry zones, often in confluence with bullish order blocks at the same level.
The setup: price impulses upward in a strong move, prints the FVG, continues higher. Days later (or hours, depending on timeframe), price pulls back into the FVG zone. The FVG holds, price reverses, and the original uptrend continues.
Bearish FVG
Forms during a downward impulse. Becomes a supply zone — a level where price is expected to find seller resistance when revisited. Traders use bearish FVGs as short entry zones, often in confluence with bearish order blocks.
The setup: price impulses downward sharply, prints the FVG, continues lower. Price retraces upward into the FVG zone. The FVG holds, price reverses, and the original downtrend continues.
Which is more reliable?
Neither, in isolation. Reliability comes from confluence — HTF alignment, FVG + order block stacking, and entry trigger discipline. A standalone FVG on the 5-minute is a coin flip. A 4-hour bullish FVG stacked with a 4-hour bullish order block aligned with a daily uptrend is a high-conviction setup.
How to identify FVGs on different timeframes
The same pattern, scaled across timeframes, has dramatically different implications.
Daily FVG
- Forms a few times per month on Bitcoin
- Often takes weeks or months to fill
- High defensive interest when tested — significant reaction expected
- Best used for swing or position entries
4-hour FVG
- Forms several times per week on Bitcoin
- Usually fills within days to a couple of weeks
- Strong defensive interest, good for swing entries
- Useful as HTF context for lower-TF entries
1-hour FVG
- Forms multiple times per day
- Usually fills within hours to a few days
- Medium defensive interest, suitable for day trading
- Best when aligned with 4-hour direction
15-minute FVG
- Forms continuously during volatile sessions
- Often fills within hours
- Lower defensive interest, used by short-term day traders
- Best inside HTF zones
5-minute and below
- Form constantly
- Many fail or get superseded by larger moves
- Used as entry triggers within HTF zones, not as standalone setups
- Scalper territory — see scalping crypto for context
The chart hygiene rule
Don’t mark FVGs on every timeframe. The chart becomes unreadable. Mark FVGs on your bias timeframe (usually 4-hour or daily) and your entry timeframe (usually 5-minute or 15-minute). Ignore everything else.
The wider question of crypto trading time frames is covered in detail in its own post.
“Premium” vs “discount” FVGs (above/below 50% of a range)
This is one of the layers ICT adds on top of the basic FVG concept. It changes how you weight FVGs in your bias.
The 50% rule
Take any defined range — the most recent swing high to swing low. The 50% level (equilibrium) splits the range into two halves:
- Premium = the upper half of the range. Prices here are “above fair value”
- Discount = the lower half of the range. Prices here are “below fair value”
What this means for FVGs
- Bullish FVGs that sit in DISCOUNT are higher probability for long entries. You’re buying at “discount” prices — institutional logic says smart money does the same.
- Bearish FVGs that sit in PREMIUM are higher probability for short entries. You’re selling at “premium” prices.
When this filter matters most
In ranging markets. When the broader market is rangebound between an HTF swing high and swing low, the premium/discount filter helps you pick which FVGs are worth trading. In strong directional trends, the filter matters less — the trend is the dominant signal.
Practical application
Mark the most recent 4-hour range high and low. Draw the 50% level. Only take bullish FVG entries on the discount side and bearish FVG entries on the premium side. Watch your hit rate move up.
Combining FVG + order block
The single highest-probability setup in the SMC toolkit.
When the strong impulse candle that creates the FVG ALSO validates an order block, you have two overlapping zones at the same price level. Both are signalling the same direction. Both have defensive interest. Price returning to that level has two reasons to react.
How the stack forms
- Price prints a pullback (the last opposing candle of which is your order block)
- A strong impulse follows, breaking structure
- The impulse leaves an FVG in its wake
- The order block and the FVG sit at the same level (often the FVG completely overlaps the order block)
Why this works so consistently
- The order block says: institutional positioning is at this level
- The FVG says: there’s an unbalanced auction here that wants to be filled
- Together they say: institutions will defend the level, AND the auction needs to revisit
Two independent reasons aligned at one price = high conviction.
The entry
When price returns to the stacked FVG + order block zone:
- Drop to lower timeframe inside the zone
- Wait for LTF CHoCH
- Enter on the LTF pullback after the CHoCH
- Stop loss outside the HTF zone (below the bottom of both the FVG and order block for longs)
- Target the next opposing FVG or zone
The order block trading crypto sibling post covers the order block mechanics in detail.
Combining FVG + liquidity sweep
Another power combo. FVGs that form immediately after a liquidity sweep.
The pattern
- Price approaches a clear swing high or low (where stops are clustered)
- A wick sweeps through the swing, triggering stops
- The reversal candle launches in the opposite direction
- The reversal leg creates an FVG
That FVG, formed in the immediate aftermath of a stop hunt, is often the cleanest version of the pattern. Reasons:
- The sweep itself confirmed the framework (smart money grabbed liquidity)
- The impulse out of the sweep was strong enough to create the FVG (real conviction behind the reversal)
- The FVG sits in a position where the next leg can run for distance
Entry approach
When price pulls back into the post-sweep FVG, you enter in the direction of the reversal. The stop loss sits behind the sweep wick — if price returns there, the sweep failed and the framework is invalidated.
This is one of my highest-conviction setups. Sweep + FVG + HTF alignment is what I look for first when I sit down to trade.
The liquidity sweeps crypto post covers sweep identification in detail.
Entry rules using FVG
The honest answer: you don’t enter on first touch of an FVG. You wait for confirmation. Most traders skip this rule and wonder why their FVG trades fail.
The structured entry sequence
- HTF context check — daily and 4-hour are aligned with the direction the FVG suggests
- FVG identified on bias timeframe — usually 4-hour or 1-hour
- Price returns to FVG zone
- Drop to lower timeframe — 5-minute or 1-minute
- Wait for LTF CHoCH — confirms the FVG is being defended
- Enter on the LTF pullback after CHoCH — small risk, defined level
- Stop loss outside the HTF FVG with a small buffer
Aggressive vs conservative entry
- Aggressive — limit order at the top (or bottom) of the FVG zone, no LTF confirmation. Higher hit rate when FVGs fill cleanly. Higher loss rate when FVGs are clean breakthroughs.
- Conservative — LTF CHoCH confirmation before entry. Lower hit rate (some setups never trigger). Higher win rate when they do.
Most retail traders should run the conservative entry. It’s harder to develop the patience for it, but the journal results are better long-term.
Stop loss placement
The FVG framework gives you a defined zone of invalidation, same as order blocks.
The rule
- Bullish FVG long entry — stop loss below the BOTTOM of the FVG, plus a small buffer for wick (0.1-0.5% depending on volatility)
- Bearish FVG short entry — stop loss above the TOP of the FVG, plus a small buffer
Why outside the zone
If price closes outside the FVG entirely, the imbalance has been “broken through” rather than filled. The setup is invalidated. The stop loss should mark this level — not your entry price, not a percentage, but the structural boundary of the zone.
Buffer logic
The buffer protects against wicks. Market makers regularly engineer one-tick wicks beyond obvious zones to trigger stops before the actual move begins. A 0.25% buffer on Bitcoin’s 1-hour chart is reasonable. On altcoins, go wider. On the daily chart, narrower.
The broader how to set stop losses crypto post covers the wider stop loss framework. Crypto position sizing handles how big each FVG trade should be relative to your account.
Take profit using the next FVG
The SMC framework gives you clean target zones — usually the next opposing FVG or major liquidity pool.
Target 1: Next opposing FVG
For a long entry off a bullish FVG, the first take-profit target is the next bearish FVG above. For a short entry off a bearish FVG, the first target is the next bullish FVG below.
This is where 50% of the position usually closes. Tight, mechanical, repeatable.
Target 2: Next major liquidity pool
The next unswept swing high (for longs) or swing low (for shorts). Another 25-30% of the position closes here.
Target 3: HTF zone
The remaining position runs to the next 4-hour or daily opposing zone. Trail stop loss aggressively. The position can run for days if the HTF trend is strong.
Why ladder
A single take-profit forces you to predict exactly where the move stops. Laddering acknowledges the uncertainty. You bank a profit early; you let the remainder run for the moonshot.
Realistic R:R
A well-structured FVG entry targets 2:1 minimum risk-reward. Often 3:1 or higher when the next opposing zone is far. If the targets don’t allow at least 2:1, skip the trade.
When FVGs DON’T get filled (the failed-FVG pattern)
Not every FVG fills. The unfilled FVG is itself a pattern with tradeable implications.
What unfilled FVGs mean
When price walks away from an FVG without returning to fill it, the imbalance has been “ignored” by the market. The directional pressure on the original side is strong enough to override the auction-balance mechanism. This is bullish (for bullish FVGs that don’t fill) or bearish (for bearish FVGs that don’t fill).
The continuation trade
The trader who recognises an unfilled FVG often uses the persistence as a continuation signal. If a bullish FVG forms on the daily and price doesn’t even attempt to fill it over the next two weeks — the underlying buying pressure is strong. Long bias persists. New bullish FVGs at higher prices become the new entry zones.
How to spot a failed FVG
- The FVG has been on the chart for at least 20 candles on the timeframe it was formed
- Price has not made any meaningful attempt to retest it
- The original directional move has continued — newer FVGs have formed further in the same direction
- The structural bias is clearly trending in the FVG’s direction
Trading the failed FVG
The play isn’t to trade the FVG itself — it’s to use the failure as a continuation signal and trade the newer FVGs (or order blocks) that have formed further along the trend.
When the unfilled FVG finally does fill
Eventually most unfilled FVGs do come back, sometimes after weeks or months. By then the higher-timeframe trend may have shifted. Treat the eventual fill as a structural event — it may signal a major reversal. Reassess HTF context before assuming the original direction continues.
Where I learnt this (TTC TBD System)
Free YouTube content can show you the FVG pattern. It cannot teach you the filters that separate tradeable FVGs from noise. The reason: FVG trading depends on context — HTF alignment, premium/discount positioning, confluence with order blocks and liquidity — and context only develops with structured practice and feedback.
I learned the FVG framework I trade through TTC (Trade Travel Chill) and Annii Snelleksz’s TBD System (Trade by Design). The course path for FVGs specifically:
1. TBD System Course — the main methodology. FVGs are taught alongside order blocks and market structure as part of the broader framework. You learn to identify them inside the wider context.
2. Liquidity Course — covers liquidity pools and sweeps, and the interaction between FVGs and sweep-driven reversals. This is where the FVG + liquidity combo gets explained properly.
3. MM (Market Maker) Masterclass — covers retail-trap patterns including engineered moves into FVG zones. This is the layer that separates “I know what an FVG is” from “I can trade them under live market conditions”.
4. TBD Indicators — proprietary tools that automate FVG marking. You don’t need them to trade the framework, but they save chart-prep time.
Business Class ($88/month or $899/year) gets you the full course library, the indicators, daily market update recordings, and Discord/Telegram access. Self-paced.
First Class ($158/month or $1,610/year) adds live market updates three times daily, live trading sessions, weekly Q&A hangouts, direct access to the Cabin Crew (pro traders), exclusive advanced indicator, and the mindset coach.
Pay in crypto and you save 20%. 48-hour money-back guarantee.
The TBD System explained post covers the methodology in detail. TBD Indicators covers the tools.
Join Trade Travel Chill → (referral link)
FVG mastery requires context
TTC’s TBD System teaches FVGs inside the full SMC framework. Business Class is $88/month. Cabin Crew run live sessions on First Class.
Referral link.
The chart setup I use
I run my SMC analysis on TradingView via my BitGet account. Drawing FVGs is simple — TradingView’s rectangle tool plus a keyboard shortcut makes marking them fast. The BitGet TradingView integration lets me execute directly from the same chart.
Open a BitGet account → (referral link)
The BitGet review covers the full exchange breakdown.
Common FVG mistakes
The five mistakes I made (and saw others make) most often.
Marking every gap
Not every visible candle gap is an FVG. The three-candle pattern has to be there — candle 1 high vs candle 3 low for bullish, or candle 1 low vs candle 3 high for bearish. Random gaps in the middle of consolidation aren’t FVGs.
Trading without HTF context
A 5-minute bullish FVG against a daily downtrend has marginal probability. Always check HTF first. The wider crypto trading mistakes beginners post covers more of these.
Entering on first touch
Same trap as order blocks. Wait for LTF CHoCH inside the FVG zone before committing. The patience to wait is the difference between profitable FVG trading and break-even.
Setting stops inside the FVG
If price needs room to wick around inside the zone, stops should sit outside the zone with a buffer. Stops inside the FVG get hit before the reversal completes.
Ignoring premium/discount
Trading bullish FVGs in the premium of a range or bearish FVGs in the discount fights the underlying mean-reversion logic. Filter aggressively by premium/discount in ranging markets.
Where FVGs fit in your overall strategy
FVGs are one signal in a larger framework. They work best stacked with:
- Order blocks — see order block trading crypto
- Liquidity sweeps — see liquidity sweeps crypto
- Market structure (BOS/CHoCH) — see smart money concepts crypto
- HTF bias — see crypto trading time frames
- MM patterns — see market maker manipulation crypto
For style guidance, FVGs adapt across:
– Scalping crypto — 1-minute and 5-minute FVGs
– How to day trade crypto — 15-minute and 1-hour FVGs
– Swing trading crypto — 4-hour and daily FVGs
The best crypto trading strategy post compares the styles directly.
Starting small with FVG trading
You don’t need a big account to learn FVGs. You need a small account, tight risk per trade, and enough setups to build statistical significance.
If you’re starting with $100, the how to start trading crypto with 100 post covers what’s realistic. The summary: $100 is enough to learn, not enough to scale. Develop the framework first, then size up.
The crypto trading for beginners post sits as the top-of-funnel for beginners. How long to learn crypto trading sets realistic timeline expectations.
FVG + context = setups that work
TTC’s TBD System teaches the context. The Cabin Crew review charts in the Discord daily. Join the community I’m part of.
Referral link.
Frequently asked questions
What is a Fair Value Gap in crypto?
A Fair Value Gap (FVG) is a three-candle pattern where the high of candle 1 sits below the low of candle 3 (bullish FVG) or the low of candle 1 sits above the high of candle 3 (bearish FVG). The pattern indicates price moved too fast for full participation, leaving an imbalance the market tends to revisit.
Do Fair Value Gaps always fill?
No. Around 70-80% of FVGs on the daily and 4-hour Bitcoin chart fill within 30 sessions according to chart-based observation. The other 20-30% become “failed FVGs” — the persistence of the directional move is itself a continuation signal.
What timeframe is best for trading FVGs?
Higher timeframes are higher probability. 4-hour and daily FVGs are most reliable. 1-hour FVGs work well for day traders. 15-minute and 5-minute FVGs work for scalpers but require tighter filter discipline.
What’s the difference between an FVG and an order block?
An order block is the last opposing candle before a strong move that broke structure. An FVG is the imbalance gap in the middle of a three-candle pattern. They often overlap at the same price level — that combo is the highest-probability SMC setup.
How do I trade Fair Value Gaps?
Identify the FVG on your bias timeframe. Wait for price to return to the zone. Drop to a lower timeframe and wait for a Change of Character confirming the zone is being defended. Enter on the LTF pullback. Stop loss outside the FVG. Target the next opposing FVG or liquidity pool.
What’s a premium FVG vs discount FVG?
A premium FVG sits in the upper half (above 50%) of a defined range. A discount FVG sits in the lower half. Bullish FVGs in discount are higher probability for long entries; bearish FVGs in premium are higher probability for short entries. The filter matters most in ranging markets.
Can I automate FVG identification?
Yes — TradingView has community indicators that auto-mark FVGs, and TTC’s TBD Indicators do this proprietarily. Automation is fine for identification but the filter and entry logic still benefit from manual judgement.
Does FVG trading work outside crypto?
Yes. FVGs were originally developed for forex. They work in indices, commodities, and equities. Crypto is arguably the cleanest market for them because of 24/7 trading and visible manipulation patterns, but the framework transfers anywhere price has an order book and impulsive moves.
Final word
Fair Value Gaps are not the whole picture. They’re one tool in the SMC toolkit. Used alone, they’re a coin flip with slightly better odds. Used in confluence with order blocks, liquidity, and HTF context, they’re one of the highest-probability setups in retail trading.
The hard part isn’t the pattern. The pattern is mechanical. The hard part is the discipline to wait for the right setup, the patience to wait for the LTF confirmation, and the consistency to follow the same rules trade after trade.
If I were starting again today, here’s the order:
- Two weeks marking FVGs on historical Bitcoin 4-hour charts. No trading.
- Add HTF context and the premium/discount filter. Find 30 examples of each type.
- Add order block overlap. Find 20 examples of the FVG + order block stack.
- Paper trade the stacked setups only. 100 trades minimum.
- Live trade with tiny size. Scale only when the journal proves consistency.
That’s the order. Anything faster and you’re paying tuition you don’t need to pay.
Right — over to you.